Hypergeometric Testing on Seattle Pets
Sat, Oct 16, 2021
4-minute read
The dataset of this blog post comes from TidyTuesday about pet names and the related information. This is a relatively simple dataset that does not have too many columns to explore, but I will analyze the dataset by using hypergeometric testing.
First, load the packages and the dataset with a few cleaning steps.
library(tidyverse)
library(lubridate)
library(tidytext)
pets <- read_csv("https://raw.githubusercontent.com/rfordatascience/tidytuesday/master/data/2019/2019-03-26/seattle_pets.csv") %>%
mutate(license_issue_date = mdy(license_issue_date),
primary_breed = str_remove(primary_breed, ",.+"),
year = year(license_issue_date),
month = month(license_issue_date))
pets## # A tibble: 52,519 x 9
## license_issue_date license_number animals_name species primary_breed
## <date> <chr> <chr> <chr> <chr>
## 1 2018-11-16 8002756 Wall-E Dog Mixed Breed
## 2 2018-11-11 S124529 Andre Dog Terrier
## 3 2018-11-21 903793 Mac Dog Retriever
## 4 2018-11-23 824666 Melb Cat Domestic Shorthair
## 5 2018-12-30 S119138 Gingersnap Cat Domestic Shorthair
## 6 2018-12-16 S138529 Cody Dog Retriever
## 7 2017-10-04 580652 Millie Dog Terrier
## 8 2018-08-09 S142558 Sebastian Cat Domestic Shorthair
## 9 2018-08-20 S142546 Madeline Cat Domestic Shorthair
## 10 2018-12-08 S123830 Cleo Cat Domestic Shorthair
## # ... with 52,509 more rows, and 4 more variables: secondary_breed <chr>,
## # zip_code <chr>, year <dbl>, month <dbl>Top 30 Names for Cats and Dogs
pets %>%
  count(animals_name,species, sort = T) %>%
  filter(species %in% c("Cat", "Dog"),
         !is.na(animals_name)) %>%
  group_by(species) %>%
  slice_max(order_by = n, n = 30) %>%
  ungroup() %>%
  mutate(animals_name = reorder_within(animals_name, n, species)) %>%
  ggplot(aes(n, animals_name, fill = animals_name)) +
  geom_col(show.legend = F) +
  facet_wrap(~species, scales = "free", ncol = 1) +
  scale_y_reordered() +
  theme(
    strip.text = element_text(size = 15, face = "bold")
  ) +
  labs(x = "name count",
       y = "pet name",
       title = "Top 30 Pet Name Count Faceted by Cat & Dog")
pets %>%
  count(year, month, species, sort = T) %>%
  mutate(date = make_date(year,month)) %>%
  ggplot(aes(date, n, color = species)) +
  geom_line() +
  labs(x = "year",
       y = "species count")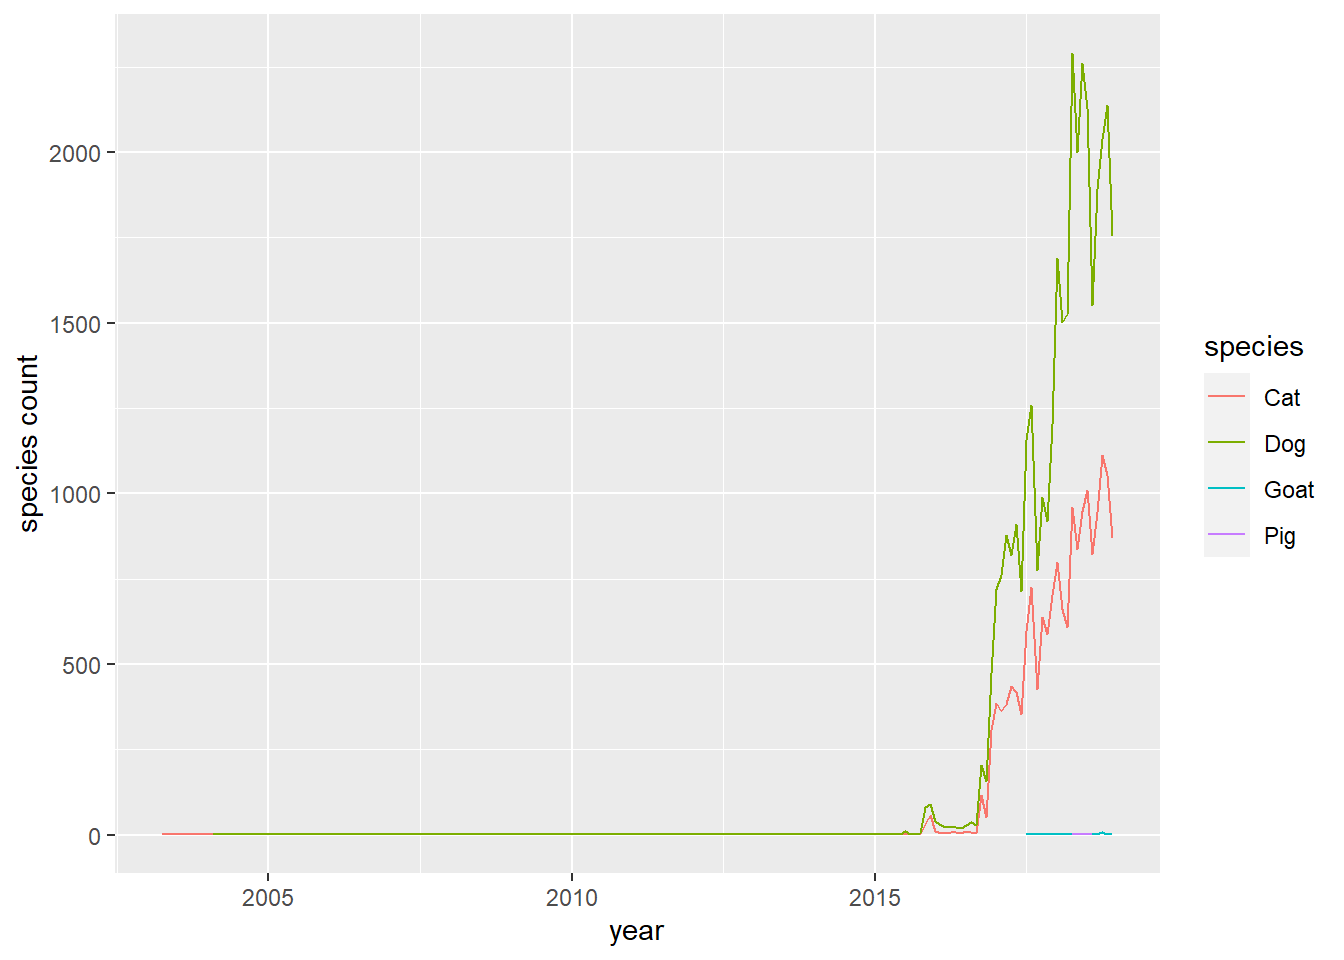
The following dog hypergeometric test is inspired and followed by David Robinson’s code.
Dog Name Hypergeometric Test
dogs <- pets %>%
  filter(species == "Dog")

name_counts <- dogs %>%
  count(animals_name, name = "name_total") %>%
  filter(name_total > 100)

breed_counts <- dogs %>%
  count(primary_breed, name = "breed_total") %>%
  filter(breed_total >= 200)

total_dogs <- nrow(dogs)

name_breed_counts <- dogs %>%
  count(primary_breed, animals_name) %>%
  complete(primary_breed, animals_name, fill = list(n = 0)) %>%
  inner_join(name_counts, by = "animals_name") %>%
  inner_join(breed_counts, by = "primary_breed")

# One-sided hypergeometric p-value
hypergeom_test <- name_breed_counts %>%
  mutate(percent_of_breed = n / breed_total,
         percent_name_overall = name_total / total_dogs) %>%
  mutate(overrepresented_ratio = percent_of_breed / percent_name_overall) %>%
  arrange(desc(overrepresented_ratio)) %>%
  mutate(hypergeom_p_value = 1 - phyper(n, name_total, total_dogs - name_total, breed_total),
         holm_p_value = p.adjust(hypergeom_p_value),
         fdr = p.adjust(hypergeom_p_value, method = "fdr"))

hypergeom_test %>%
  filter(fdr < .05)
## # A tibble: 4 x 11
## primary_breed animals_name n name_total breed_total percent_of_breed
## <chr> <chr> <dbl> <int> <int> <dbl>
## 1 Boxer Rocky 8 113 485 0.0165
## 2 Pug Zoe 8 117 554 0.0144
## 3 Beagle Lucy 19 337 542 0.0351
## 4 Retriever Lucy 99 337 7225 0.0137
## # ... with 5 more variables: percent_name_overall <dbl>,
## # overrepresented_ratio <dbl>, hypergeom_p_value <dbl>, holm_p_value <dbl>,
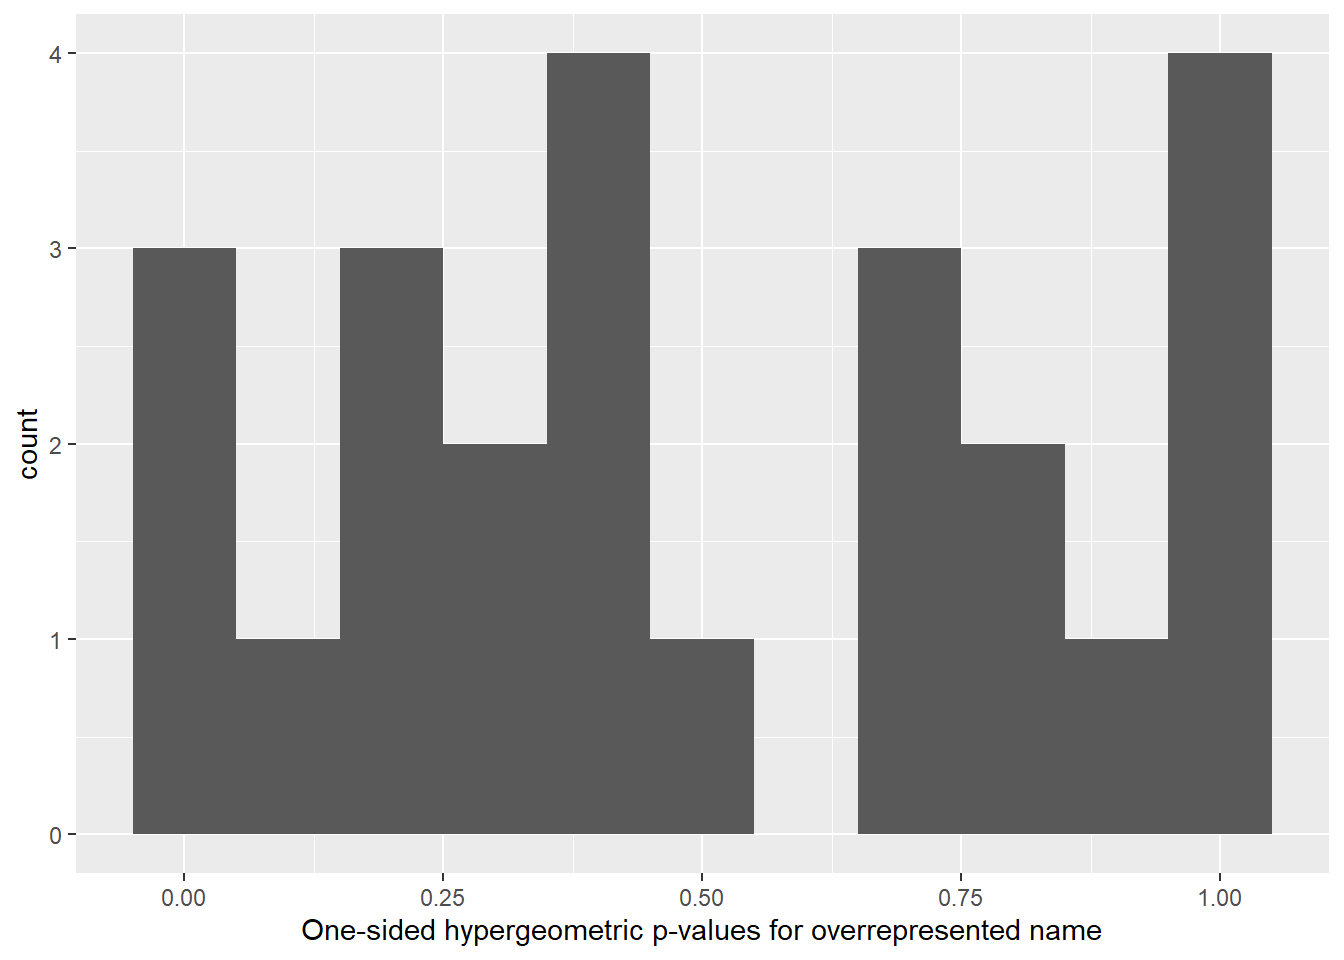
## # fdr <dbl>ggplot(hypergeom_test, aes(hypergeom_p_value)) +
geom_histogram(binwidth = .1) +
labs(x = "One-sided hypergeometric p-values for overrepresented name")
Based on the output above, Rocky, Zoe, Lucy and Lucy are pet names that overrepresent Boxer, Pug, Beagle and Retriever respectively.
Cat Name Hypergeometric Test
By following the same process as what I did above, here is the same process to deal with cat names.
cats <- pets %>%
  filter(species == "Cat")

name_counts <- cats %>%
  count(animals_name, name = "name_total") %>%
  filter(name_total > 100)

breed_counts <- cats %>%
  count(primary_breed, name = "breed_total") %>%
  filter(breed_total >= 200)

total_cats <- nrow(cats)

name_breed_counts <- cats %>%
  count(primary_breed, animals_name) %>%
  complete(primary_breed, animals_name, fill = list(n = 0)) %>%
  inner_join(name_counts, by = "animals_name") %>%
  inner_join(breed_counts, by = "primary_breed")

# One-sided hypergeometric p-value
hypergeom_test <- name_breed_counts %>%
  mutate(percent_of_breed = n / breed_total,
         percent_name_overall = name_total / total_dogs) %>%
  mutate(overrepresented_ratio = percent_of_breed / percent_name_overall) %>%
  arrange(desc(overrepresented_ratio)) %>%
  mutate(hypergeom_p_value = 1 - phyper(n, name_total, total_cats - name_total, breed_total),
         holm_p_value = p.adjust(hypergeom_p_value),
         fdr = p.adjust(hypergeom_p_value, method = "fdr"))

hypergeom_test %>%
  filter(fdr < .05)
## # A tibble: 1 x 11
## primary_breed animals_name n name_total breed_total percent_of_breed
## <chr> <chr> <dbl> <int> <int> <dbl>
## 1 Domestic Shorthair <NA> 296 406 10086 0.0293
## # ... with 5 more variables: percent_name_overall <dbl>,
## # overrepresented_ratio <dbl>, hypergeom_p_value <dbl>, holm_p_value <dbl>,
## # fdr <dbl>ggplot(hypergeom_test, aes(hypergeom_p_value)) +
geom_histogram(binwidth = .1) +
labs(x = "One-sided hypergeometric p-values for overrepresented name")