The Simpsons Data Visualization
Mon, Nov 22, 2021
3-minute read
In this blog post, I will analyze the Simpsons dataset from TidyTuesday about its guest stars.
library(tidyverse)
theme_set(theme_bw())
This is my first time using read_delim() to separate |. It is also the first time I recognize read_csv() does not have a delim argument.
simpsons <- readr::read_delim("https://raw.githubusercontent.com/rfordatascience/tidytuesday/master/data/2019/2019-08-27/simpsons-guests.csv", delim = "|", quote = "") %>%
  rename(episode = "number") %>%
  mutate(season = as.numeric(season))

simpsons
## # A tibble: 1,386 x 6
## season episode production_code episode_title guest_star role
## <dbl> <chr> <chr> <chr> <chr> <chr>
## 1 1 002–102 7G02 Bart the Genius Marcia Walla~ Edna Krabapp~
## 2 1 003–103 7G03 Homer's Odyssey Sam McMurray Worker
## 3 1 003–103 7G03 Homer's Odyssey Marcia Walla~ Edna Krabapp~
## 4 1 006–106 7G06 Moaning Lisa Miriam Flynn Ms. Barr
## 5 1 006–106 7G06 Moaning Lisa Ron Taylor Bleeding Gum~
## 6 1 007–107 7G09 The Call of the S~ Albert Brooks Cowboy Bob
## 7 1 008–108 7G07 The Telltale Head Marcia Walla~ Edna Krabapp~
## 8 1 009–109 7G11 Life on the Fast ~ Albert Brooks Jacques
## 9 1 010–110 7G10 Homer's Night Out Sam McMurray Gulliver Dark
## 10 1 011–111 7G13 The Crepes of Wra~ Christian Co~ Gendarme Off~
## # ... with 1,376 more rowsTotal # of roles
simpsons %>%
  mutate(guest_star = fct_lump(guest_star, n = 10)) %>%
  count(guest_star, role, sort = T) %>%
  filter(guest_star != "Other") %>%
  group_by(guest_star) %>%
  mutate(total_guest_roles = n()) %>%
  ungroup() %>%
  distinct(guest_star, total_guest_roles, .keep_all = T) %>%
  mutate(guest_star = fct_reorder(guest_star, total_guest_roles)) %>%
  ggplot(aes(total_guest_roles, guest_star, fill = guest_star)) +
  geom_col(show.legend = F) +
  labs(x = "# of roles in total",
       y = "",
       title = "Top 10 Popular Guest Stars with Most Roles")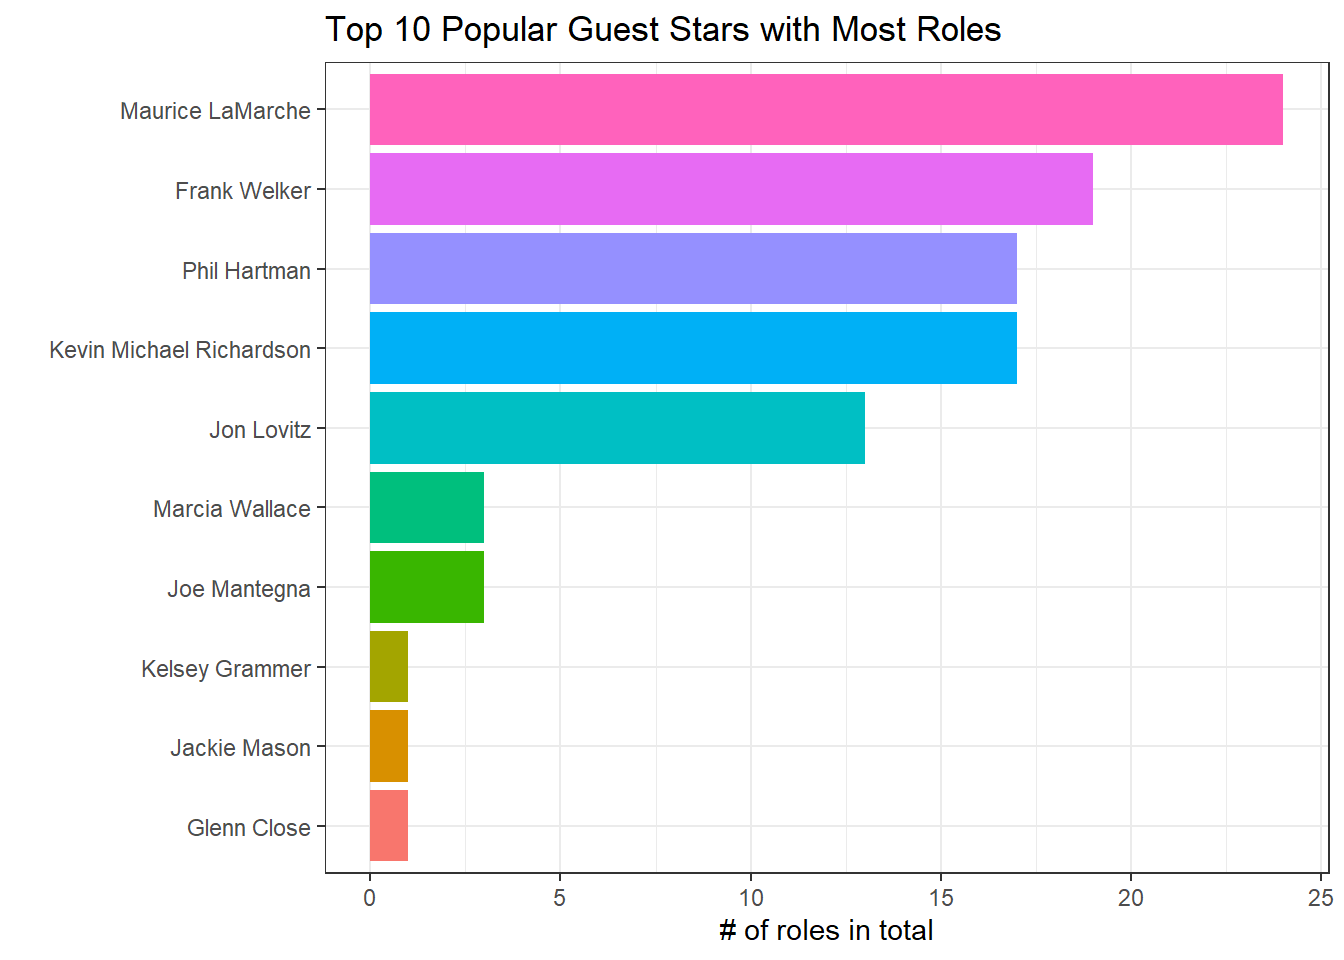
The most crowded episodes
simpsons %>%
  filter(season != "Movie") %>%
  group_by(episode_title) %>%
  mutate(num_of_episode_guests = n(),
         season = as.character(season)) %>%
  arrange(desc(num_of_episode_guests)) %>%
  distinct(episode_title, num_of_episode_guests, .keep_all = T) %>%
  ungroup() %>%
  head(50) %>%
  mutate(episode_title =  fct_reorder(episode_title, num_of_episode_guests)) %>%
  ggplot(aes(num_of_episode_guests, episode_title, fill = season)) +
  geom_col() +
  labs(x = "# of guest stars",
       y = NULL,
title = "The Episodes with Most Guest Stars") 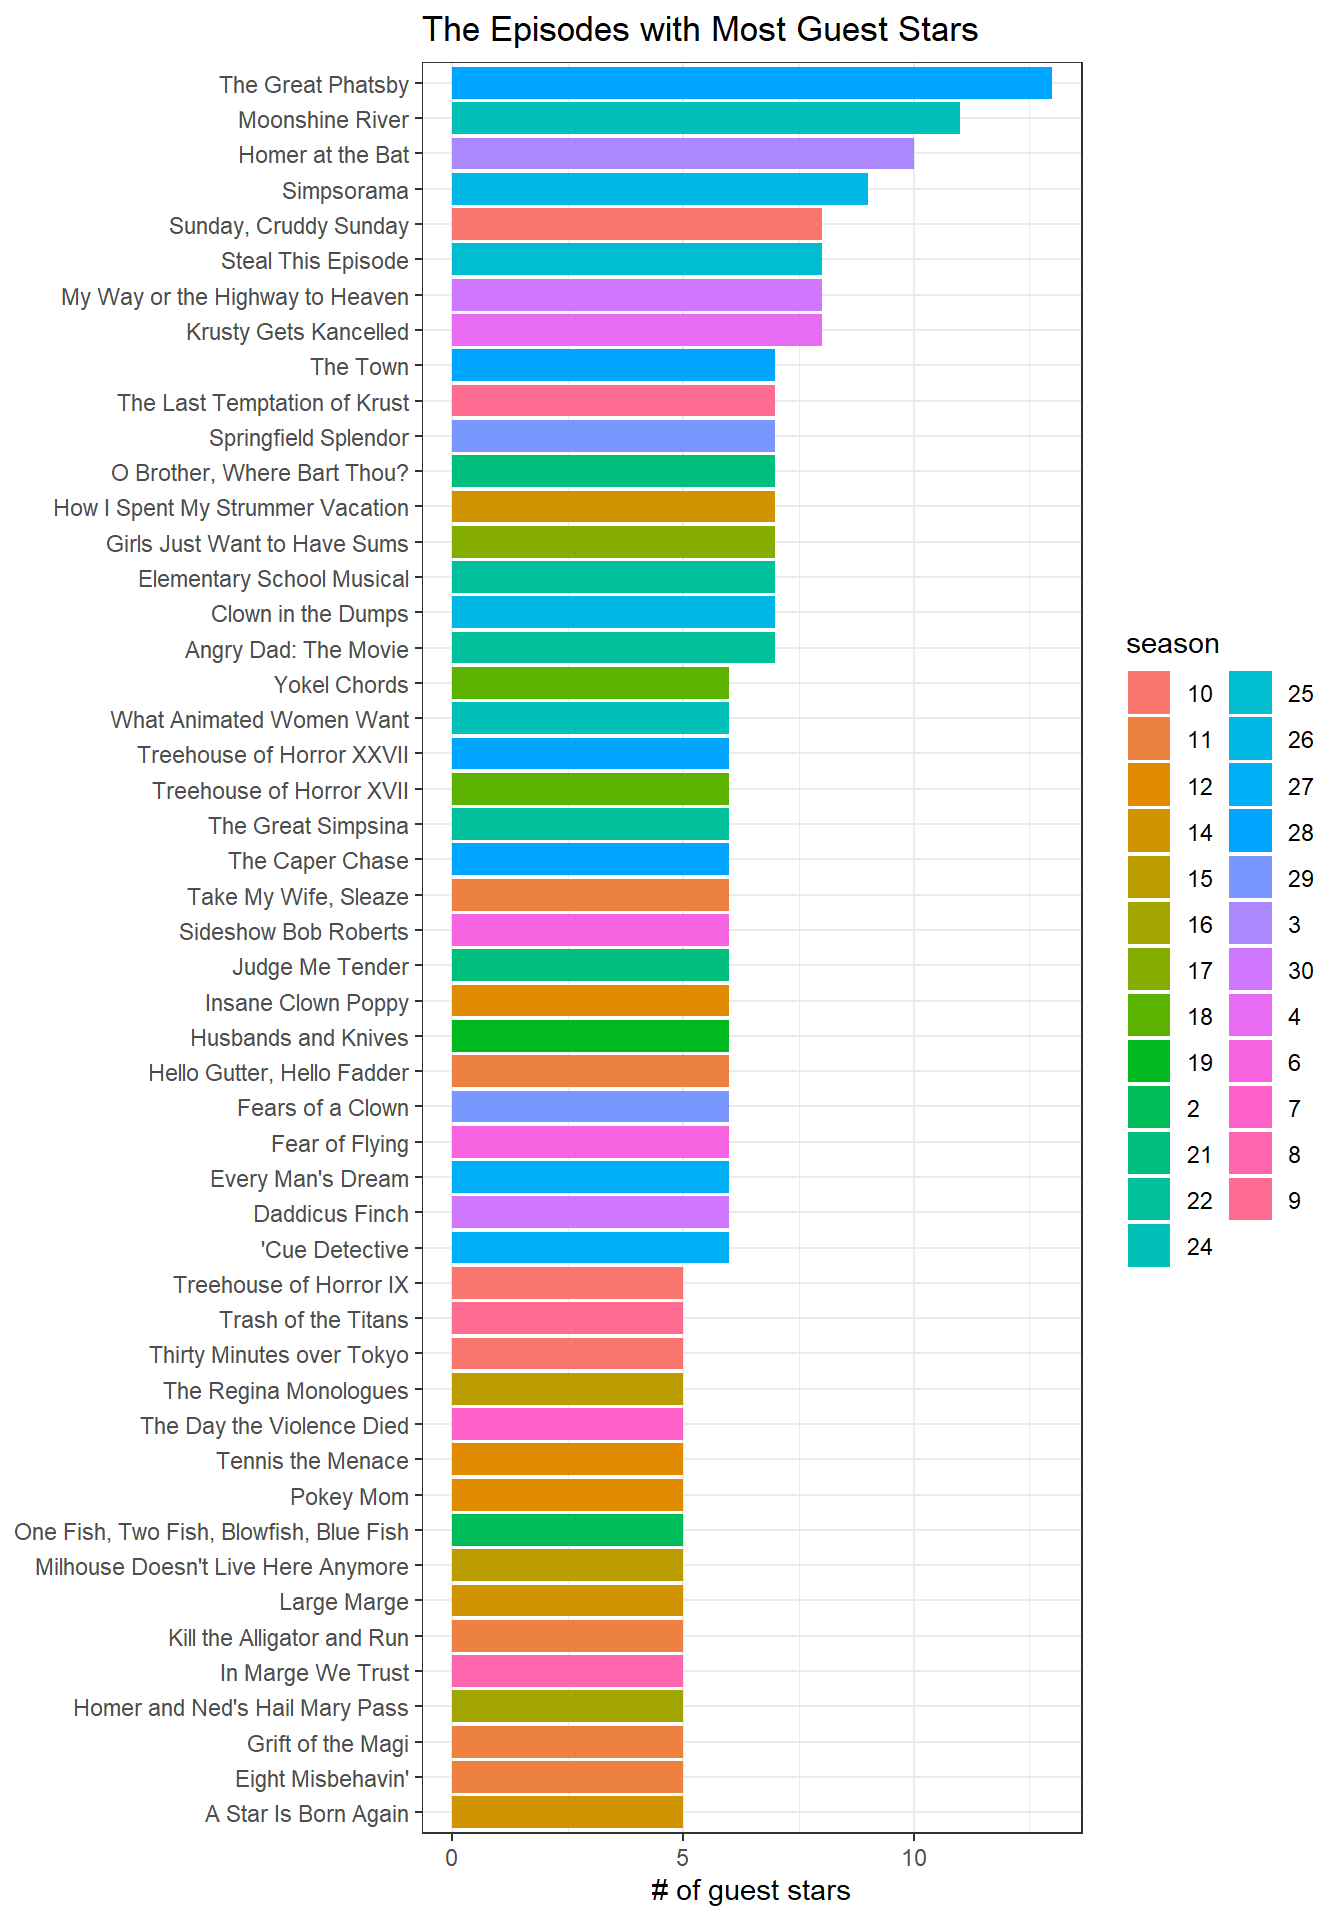
Working on self
The dataset has Himself, Herself etc. on the role column. Merging guest_star to role is helpful for further analysis.
separate_rows() is used with \\s regular expression.
role_processed <- simpsons %>%
  separate_rows(role, sep = ";\\s+") %>%
  mutate(guest_star = if_else(guest_star == "\"Weird Al\" Yankovic", "Weird Al Yankovic", guest_star)) %>%
  mutate(self = if_else(str_detect(role, "self"), "self", "not self"),
         role = if_else(str_detect(role, "self"), guest_star, role))
role_processed %>%
add_count(role) %>%
filter(n > 6) %>%
distinct(role, .keep_all = T) %>%
mutate(guest_star = fct_reorder(guest_star, n, sum)) %>%
ggplot(aes(n, guest_star, fill = role)) +
geom_col() +
labs(x = "role count",
y = "guest star",
title = "Guest Stars & Their Role Count")
How many stars play themselves in Simpsons?
role_processed %>%
  filter(self == "self") %>%
  mutate(guest_star = str_remove(guest_star, '\"')) %>%
  count(role, sort = T) %>%
  filter(n > 1) %>%
  mutate(role = fct_reorder(role, n)) %>%
  ggplot(aes(n, role)) +
  geom_col() +
  labs(x = "role count",
title = "# of Times Guest Stars Play by Themselves") 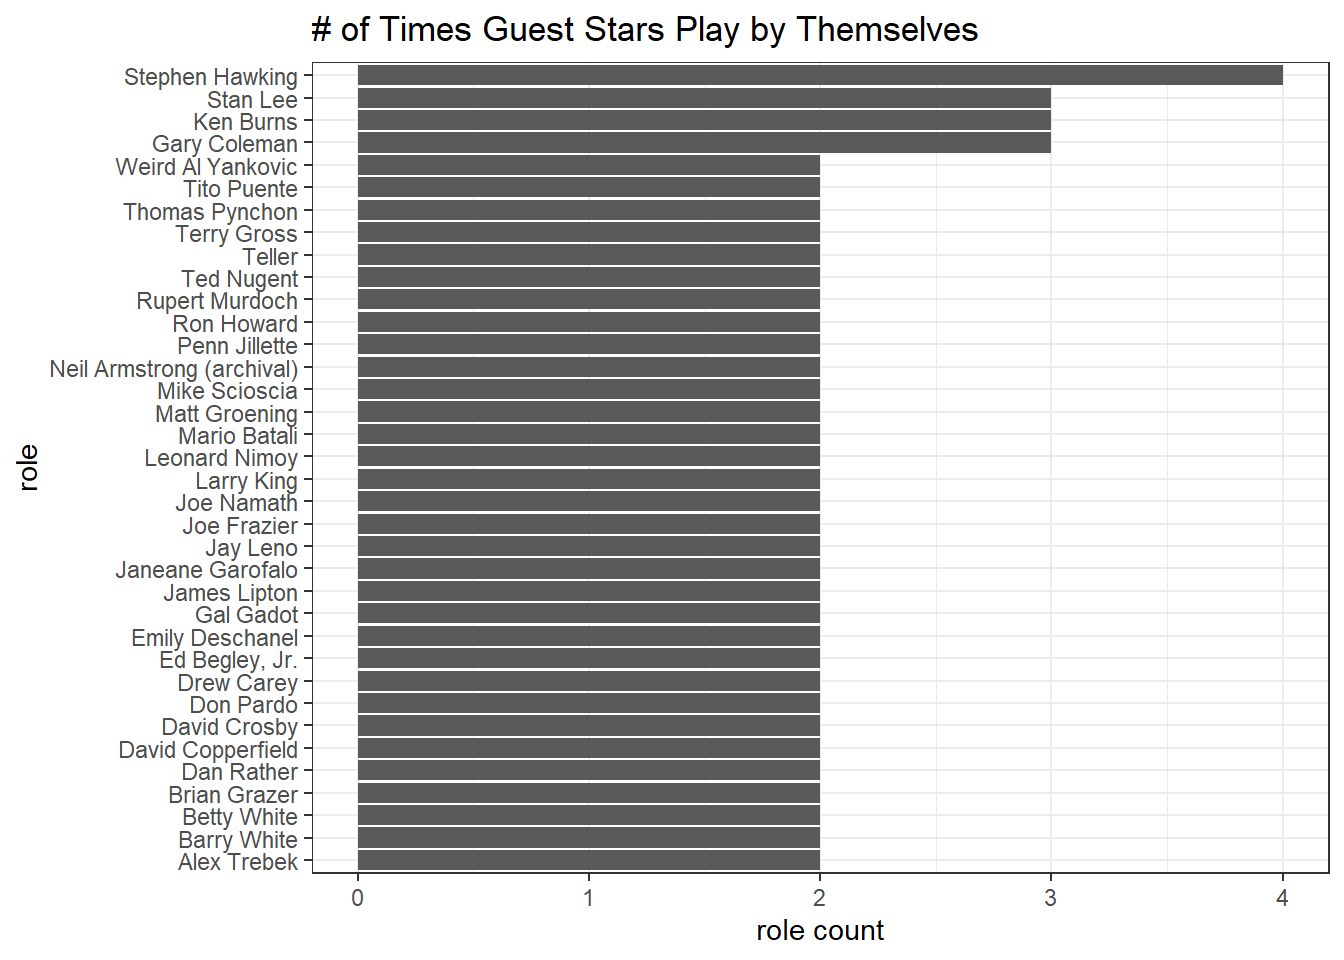
Episode Count
simpsons %>%
  distinct(episode_title, .keep_all = T) %>%
  count(season) %>%
  ggplot(aes(season, n)) +
  geom_line() +
  geom_point() +
  scale_x_continuous(breaks = seq(1,33)) +
  labs(y = "# of episodes in dataset",
       title = "# of Episodes in Each Season",
       subtitle = "The true # of episodes might not be reflected on the dataset")