NYC Squirrels Data Visualization
Thu, Dec 2, 2021
3-minute read
This blog post analyzes the dataset about squirrels in NYC. Here is the link of the dataset.
library(tidyverse)
library(tidytext)
library(lubridate)
theme_set(theme_bw())
nyc_squirrels <- readr::read_csv("https://raw.githubusercontent.com/rfordatascience/tidytuesday/master/data/2019/2019-10-29/nyc_squirrels.csv") %>%
mutate(date = mdy(date))
nyc_squirrels## # A tibble: 3,023 x 36
## long lat unique_squirrel_~ hectare shift date hectare_squirre~ age
## <dbl> <dbl> <chr> <chr> <chr> <date> <dbl> <chr>
## 1 -74.0 40.8 37F-PM-1014-03 37F PM 2018-10-14 3 <NA>
## 2 -74.0 40.8 37E-PM-1006-03 37E PM 2018-10-06 3 Adult
## 3 -74.0 40.8 2E-AM-1010-03 02E AM 2018-10-10 3 Adult
## 4 -74.0 40.8 5D-PM-1018-05 05D PM 2018-10-18 5 Juve~
## 5 -74.0 40.8 39B-AM-1018-01 39B AM 2018-10-18 1 <NA>
## 6 -74.0 40.8 33H-AM-1019-02 33H AM 2018-10-19 2 Juve~
## 7 -74.0 40.8 6G-PM-1020-02 06G PM 2018-10-20 2 Adult
## 8 -74.0 40.8 35C-PM-1013-03 35C PM 2018-10-13 3 <NA>
## 9 -74.0 40.8 7B-AM-1008-09 07B AM 2018-10-08 9 Adult
## 10 -74.0 40.8 32E-PM-1017-14 32E PM 2018-10-17 14 Adult
## # ... with 3,013 more rows, and 28 more variables: primary_fur_color <chr>,
## # highlight_fur_color <chr>,
## # combination_of_primary_and_highlight_color <chr>, color_notes <chr>,
## # location <chr>, above_ground_sighter_measurement <chr>,
## # specific_location <chr>, running <lgl>, chasing <lgl>, climbing <lgl>,
## # eating <lgl>, foraging <lgl>, other_activities <chr>, kuks <lgl>,
## # quaas <lgl>, moans <lgl>, tail_flags <lgl>, tail_twitches <lgl>, ...Squirrel locations colored by age
nyc_squirrels %>%
  filter(age != "?") %>%
  ggplot(aes(long, lat, color = age)) +
  geom_point() +
  theme_void() +
  labs(color = NULL,
       title = "Where are the adult and young squirrels?")
It is shaped like the Central Park.
Squirrel fur colors
nyc_squirrels %>%
  filter(age != "?") %>%
  count(age, primary_fur_color, highlight_fur_color, sort = T) %>%
  ggplot(aes(primary_fur_color, highlight_fur_color, fill = n)) +
  geom_tile() +
  facet_wrap(~age, ncol = 1) +
  theme(panel.grid = element_blank(),
        strip.text = element_text(size = 15),
        plot.title = element_text(size = 18)) +
  scale_fill_gradient2(low = "red",
                       high = "green",
                       mid = "pink",
                       midpoint = 200) +
  labs(x = "primary fur color",
       y = "highlight fur color",
       fill = "# of squirrels",
       title = "Squirrel Fur Colors")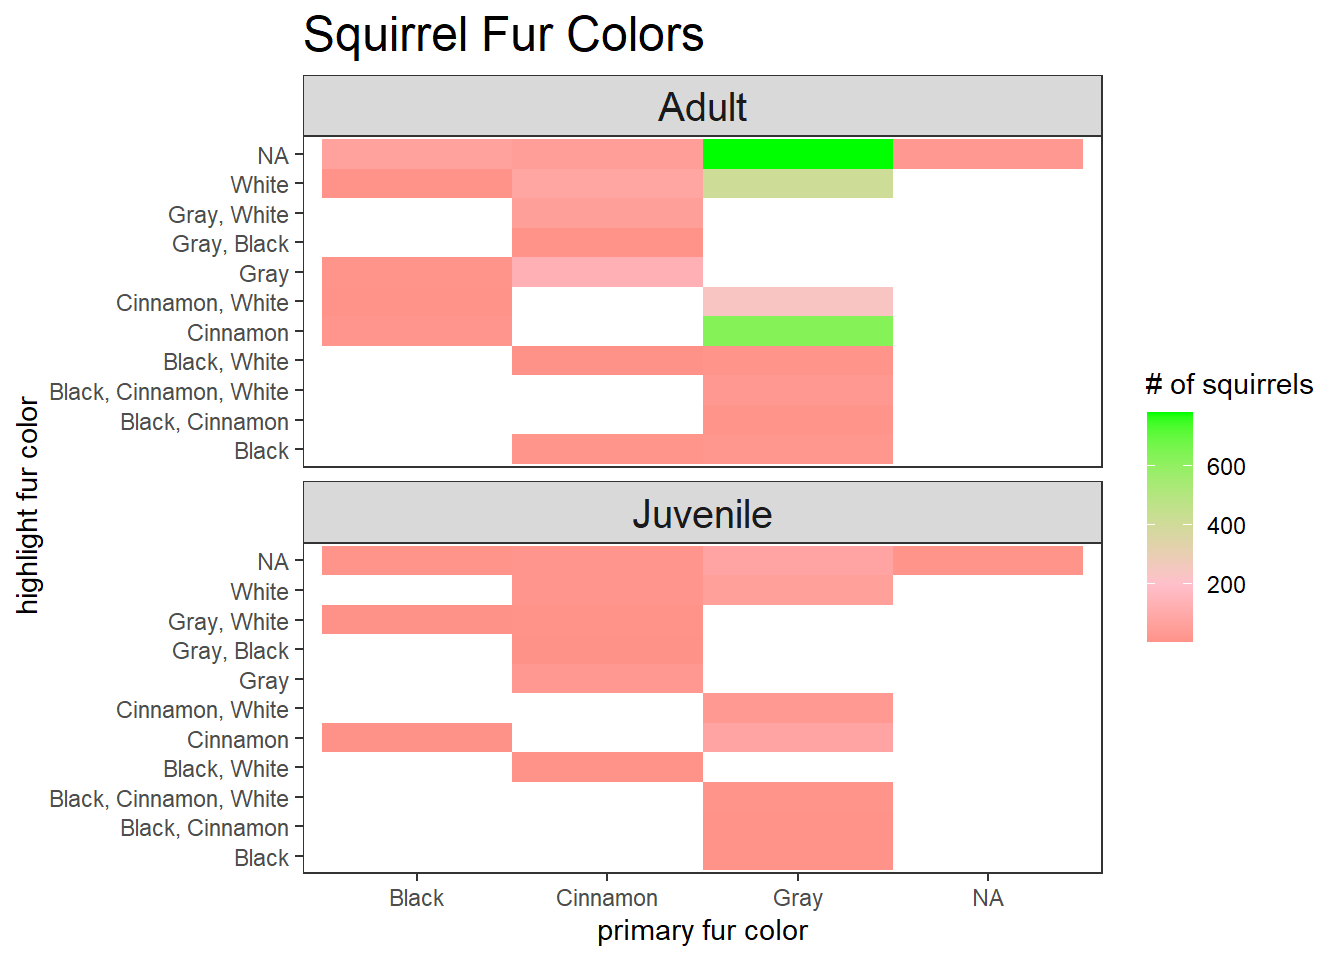
Locations where the squirrels were sighted
nyc_squirrels %>%
  filter(age != "?") %>%
  count(age, location, shift, sort = T) %>%
  ggplot(aes(n, location, fill = age)) +
  geom_col(position = "dodge") +
  facet_grid(age ~ shift) +
  theme(legend.position = "none",
        strip.text = element_text(size = 15),
        plot.title = element_text(size = 18)) +
  labs(x = "# of squirrels",
title = "Where are the adult and juvenile squirrels between morning and evening?") 
It seems like more squirrels are at “Ground Plane” during PM for both adult and juvenile squirrels.
What is the squirrels’ action like?
pivot_columns <- nyc_squirrels %>%
  select_if(is.logical) %>%
  names()

squirrel_pivot <- nyc_squirrels %>%
  pivot_longer(cols = pivot_columns, names_to = "action")
## Note: Using an external vector in selections is ambiguous.
## i Use `all_of(pivot_columns)` instead of `pivot_columns` to silence this message.
## i See <https://tidyselect.r-lib.org/reference/faq-external-vector.html>.
## This message is displayed once per session.squirrel_pivot %>%
filter(age != "?") %>%
count(age, action, value, sort = T) %>%
filter(value) %>%
mutate(action = str_replace(action, "_", " ")) %>%
mutate(action = reorder_within(action, n, age)) %>%
ggplot(aes(n, action, fill = action)) +
geom_col(show.legend = F) +
scale_y_reordered() +
theme(legend.position = "none",
strip.text = element_text(size = 15),
plot.title = element_text(size = 18)) +
facet_wrap(~age, ncol = 1, scales = "free_y") +
labs(x = "# of squirrels",
title = "# of squirrels' action")