CRAN Package Data Analysis & Visualization
CRAN is the official repository for R packages. Because of so many wonderful packages, such as Tidyverse, our everyday data science work has turned out to be so much easier and more convenient. While using various R packages, we can see the collective efforts made by the R community. In this blog post, I will analyze a dataset from TidyTuesday about CRAN packages.
library(tidyverse)
library(tidytext)
library(scales)
library(patchwork)
For the initial data processing stage, the tidyverse pakcages are marked by using tvse_pkg to see if pkg_name is part of the tidyverse.
cran <- read_csv("https://raw.githubusercontent.com/rfordatascience/tidytuesday/master/data/2019/2019-11-12/loc_cran_packages.csv") %>%
  mutate(total_lines = blank + comment + code) %>%
  mutate(tvse_pkg = if_else(pkg_name %in% tidyverse_packages(), TRUE, FALSE))

cran
## # A tibble: 34,477 x 9
## file language blank comment code pkg_name version total_lines tvse_pkg
## <dbl> <chr> <dbl> <dbl> <dbl> <chr> <chr> <dbl> <lgl>
## 1 2 R 96 353 365 A3 1.0.0 814 FALSE
## 2 1 HTML 347 5 2661 aaSEA 1.0.0 3013 FALSE
## 3 23 R 63 325 676 aaSEA 1.0.0 1064 FALSE
## 4 3 HTML 307 9 1275 abbyyR 0.5.5 1591 FALSE
## 5 30 R 224 636 587 abbyyR 0.5.5 1447 FALSE
## 6 5 Markdown 246 0 418 abbyyR 0.5.5 664 FALSE
## 7 1 HTML 26 1 190 ABC.RAP 0.9.0 217 FALSE
## 8 11 R 32 202 141 ABC.RAP 0.9.0 375 FALSE
## 9 10 R 104 333 406 ABCanalysis 1.2.1 843 FALSE
## 10 16 R 153 62 882 abcdeFBA 0.4 1097 FALSE
## # ... with 34,467 more rowsHow many lines of code and comments written in most popular languages?
codes <- cran %>%
  mutate(language = fct_lump(language, n = 10),
         code = code + 1) %>%
  mutate(language = fct_reorder(language, code, median)) %>%
  ggplot(aes(code, language, fill = language)) +
  geom_boxplot(show.legend = F) +
  scale_x_log10(label = comma) +
  labs(x = "lines of code",
       y = NULL,
       title = "# of Code Lines for R Packages Written by Top 10 Languages")

comments <- cran %>%
  mutate(language = fct_lump(language, n = 10),
         comment = comment + 1) %>%
  mutate(language = fct_reorder(language, comment, median, na.rm = T)) %>%
  ggplot(aes(comment, language, fill = language)) +
  geom_boxplot(show.legend = F) +
  scale_x_log10(label = comma) +
  labs(x = "lines of comment",
       y = NULL,
       title = "# of Comment Lines for R Packages Written by Top 10 Languages")

codes / comments
What is the relationship between code and comment lines?
cran %>%
  group_by(pkg_name, language) %>%
  summarize_at(vars(blank, comment, code, total_lines), sum) %>%
  ungroup() %>%
  mutate(comment_ratio = comment/total_lines,
         code_ratio = code/total_lines) %>%
  arrange(desc(total_lines)) %>%
  filter(comment > 0) %>%
  head(200) %>%
  ggplot(aes(comment, code, color = pkg_name)) +
  geom_point() +
  geom_text(aes(label = pkg_name), vjust = 1, hjust = 1, check_overlap = T) +
  theme(legend.position = "none") +
  scale_x_log10() +
  scale_y_log10() +
  labs(x = "comment lines",
       y = "code lines",
title = "Top 200 Packages Code & Comment Lines") 
There is no a clear relationship between them based on the plot shown above.
Total packages files and and their code language
cran %>%
  group_by(pkg_name) %>%
  mutate(total_files = sum(file)) %>%
  ungroup() %>%
  group_by(pkg_name, language) %>%
  mutate(files = sum(file)) %>%
  arrange(desc(total_files)) %>%
  ungroup() %>%
  mutate(language = fct_lump(language, n = 6),
         pkg_name = fct_reorder(pkg_name, files, sum)) %>%
  head(200) %>%
  ggplot(aes(files, pkg_name, fill = language)) +
  geom_col() +
  guides(fill = guide_legend(reverse = T)) +
  labs(x = "# of files",
       y = "package name",
       title = "Packages & Their File Components")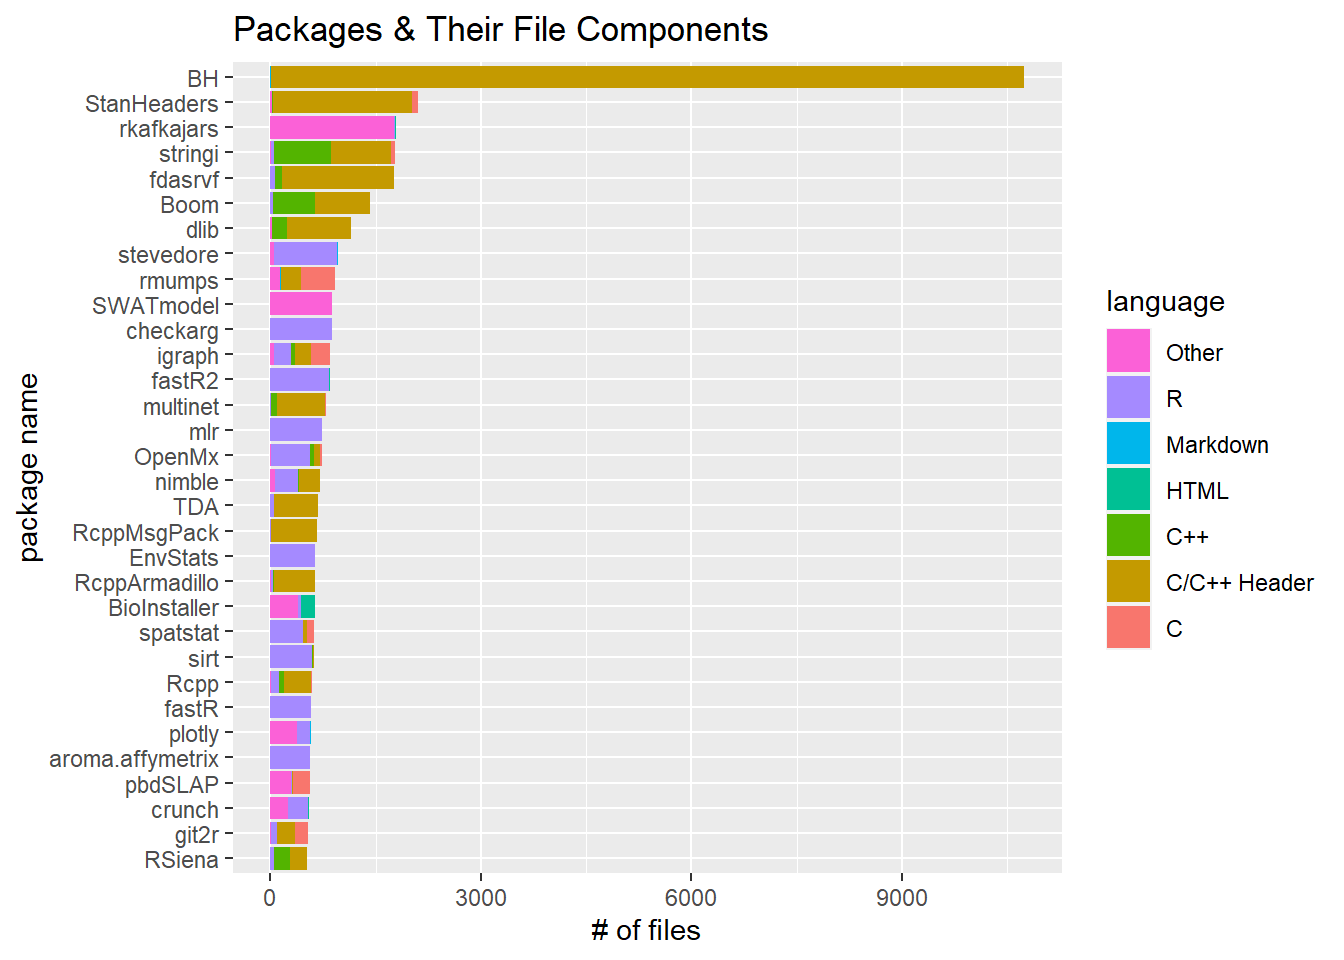
Total packages code lines and and their code language
package_50_lines <- cran %>%
  group_by(pkg_name) %>%
  mutate(total_code_lines = sum(code)) %>%
  arrange(desc(total_code_lines)) %>%
  distinct(pkg_name, total_code_lines) %>%
  head(50) %>%
  pull(pkg_name)

cran %>%
  filter(pkg_name %in% package_50_lines) %>%
  mutate(language = fct_lump(language, n = 6),
         pkg_name = fct_reorder(pkg_name, code, sum)) %>%
  ggplot(aes(code, pkg_name, fill = language)) +
  geom_col() +
  labs(y = "package name",
       title = "# of Code Lines for the 50 Packages Having the Most Lines")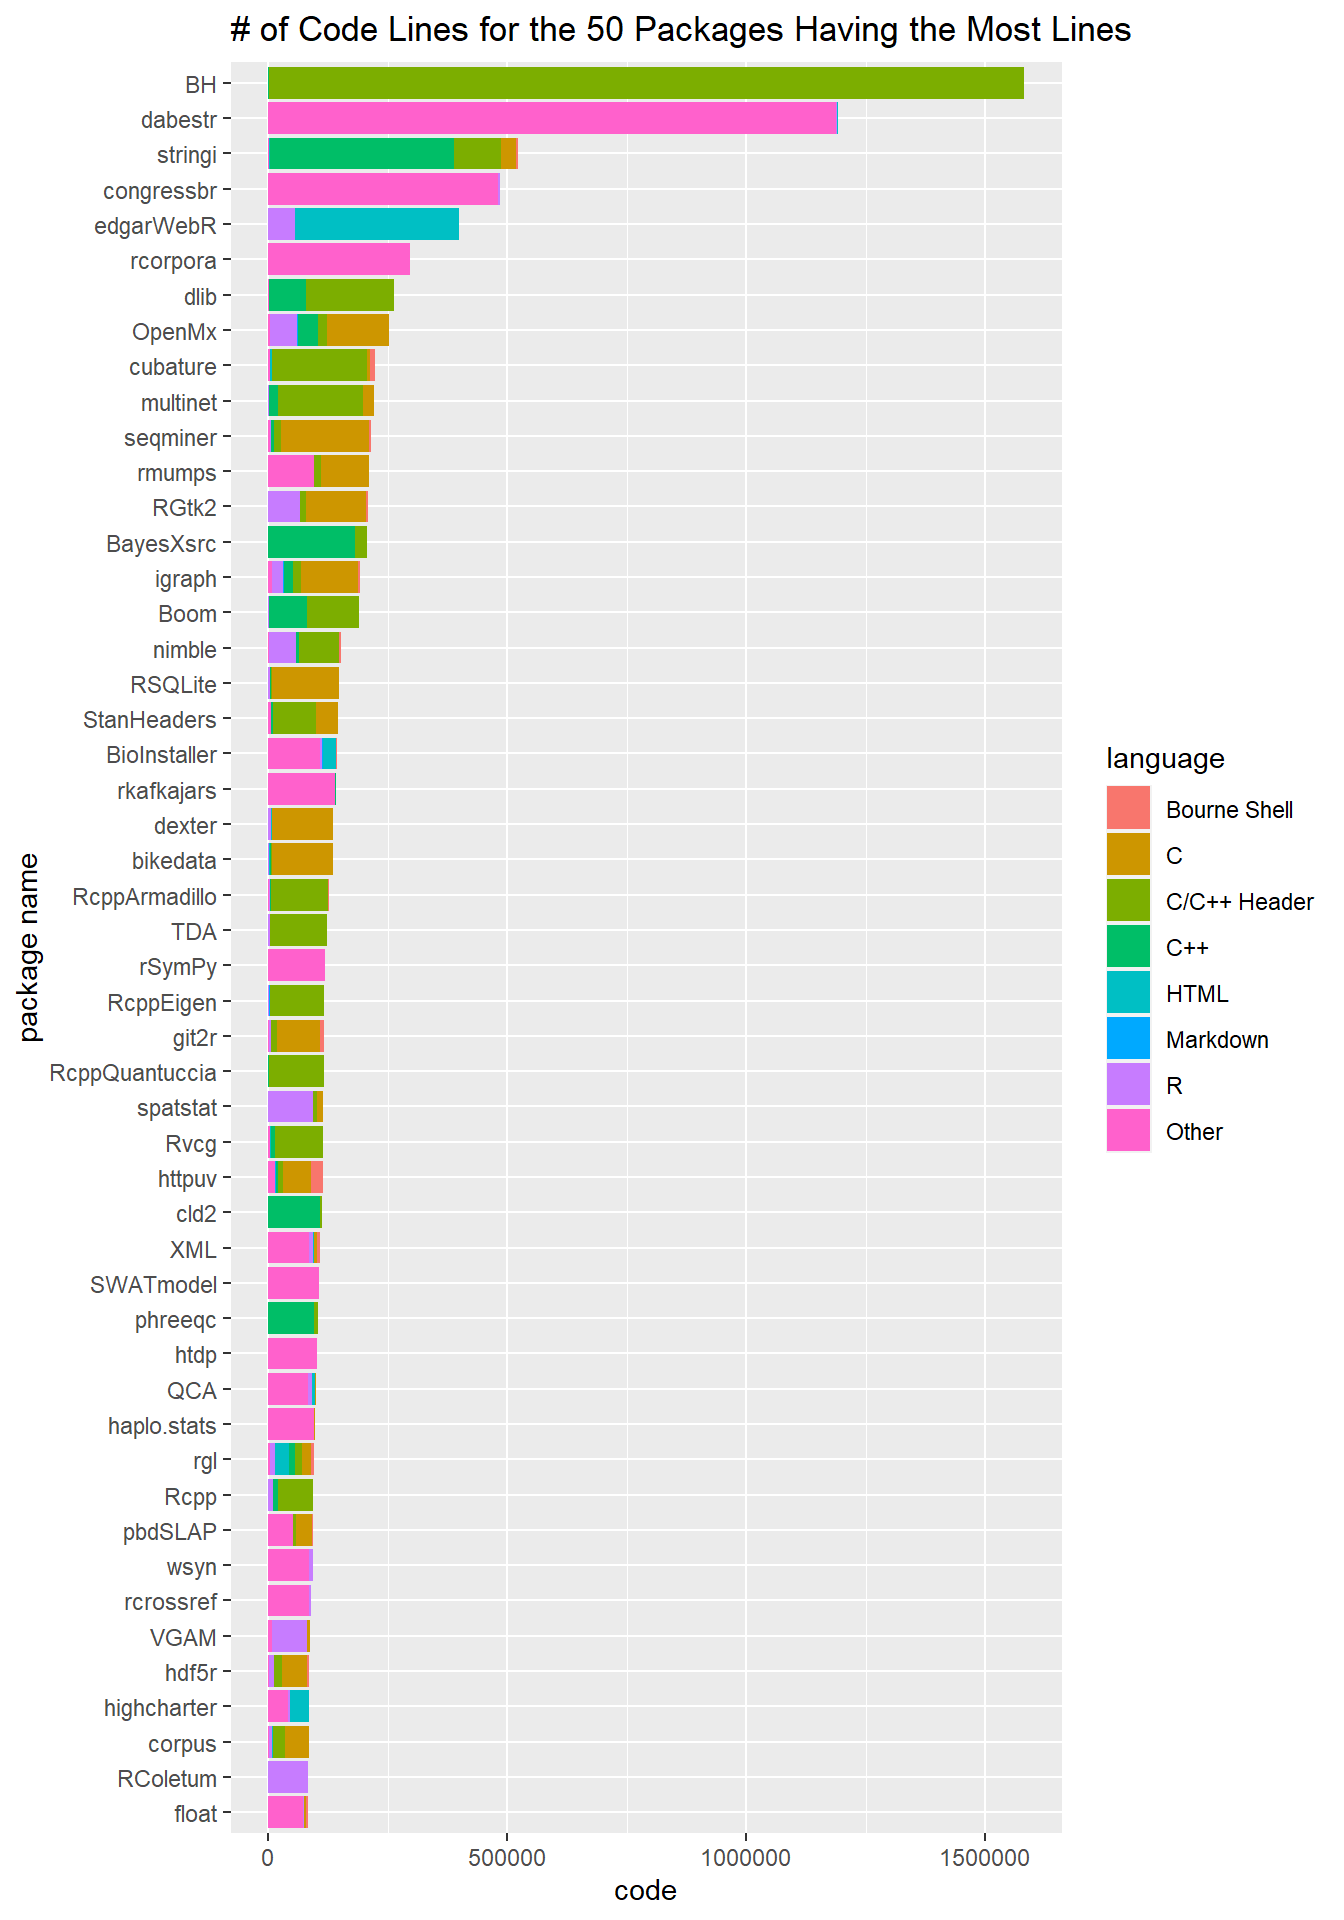
Tidyverse
Tidyverse is my favoriate meta-package all the time, and it has made my data science work so much easier. Every data science blog uses the pakcage to do the work. Without it, it would be impossible for me to imagine how data analysis can be handled at ease. It is intriguing to dive into the pakcages built into the Tidyverse.
cran %>%
  filter(tvse_pkg) %>%
  group_by(pkg_name) %>%
  summarize_at(vars(comment, code), sum) %>%
  ggplot(aes(comment, code, color = pkg_name)) +
  geom_point() +
  geom_smooth(aes(group = 1), method = "lm", se = F) +
  geom_text(aes(label = pkg_name), hjust = 1, vjust = 1, check_overlap = T) +
  theme(legend.position = "none") +
  scale_x_log10() +
  scale_y_log10() +
  labs(x = "total comment line",
       y = "total code line",
       title = "Total Comment Lines VS Total Code Line for Tidyverse Packages")
## `geom_smooth()` using formula 'y ~ x'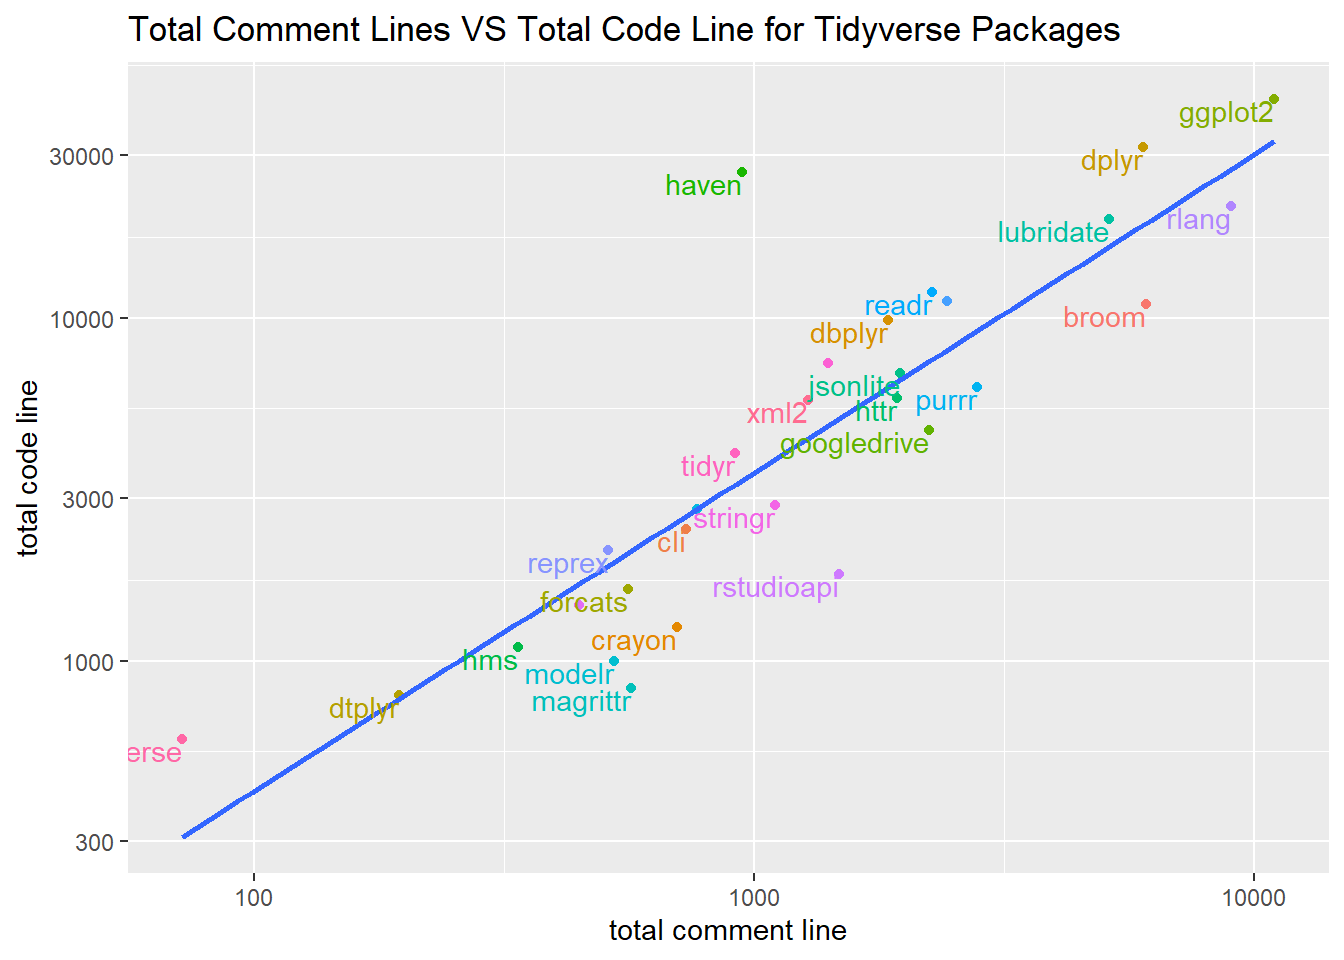
There is a good linear relationship between # of comment lines and # of code lines among the Tidyverse packages.
In addition, ggplot2 stands out in a way that it is the most code and comment heavy package in the entire the tidyverse ecosystem.
cran %>%
  filter(!tvse_pkg) %>%
  group_by(pkg_name) %>%
  summarize_at(vars(comment, code), sum) %>%
  filter(comment > 0, code > 0) %>%
  ggplot(aes(comment, code)) +
  geom_point() +
  geom_smooth(method = "lm") +
  scale_x_log10() +
  scale_y_log10()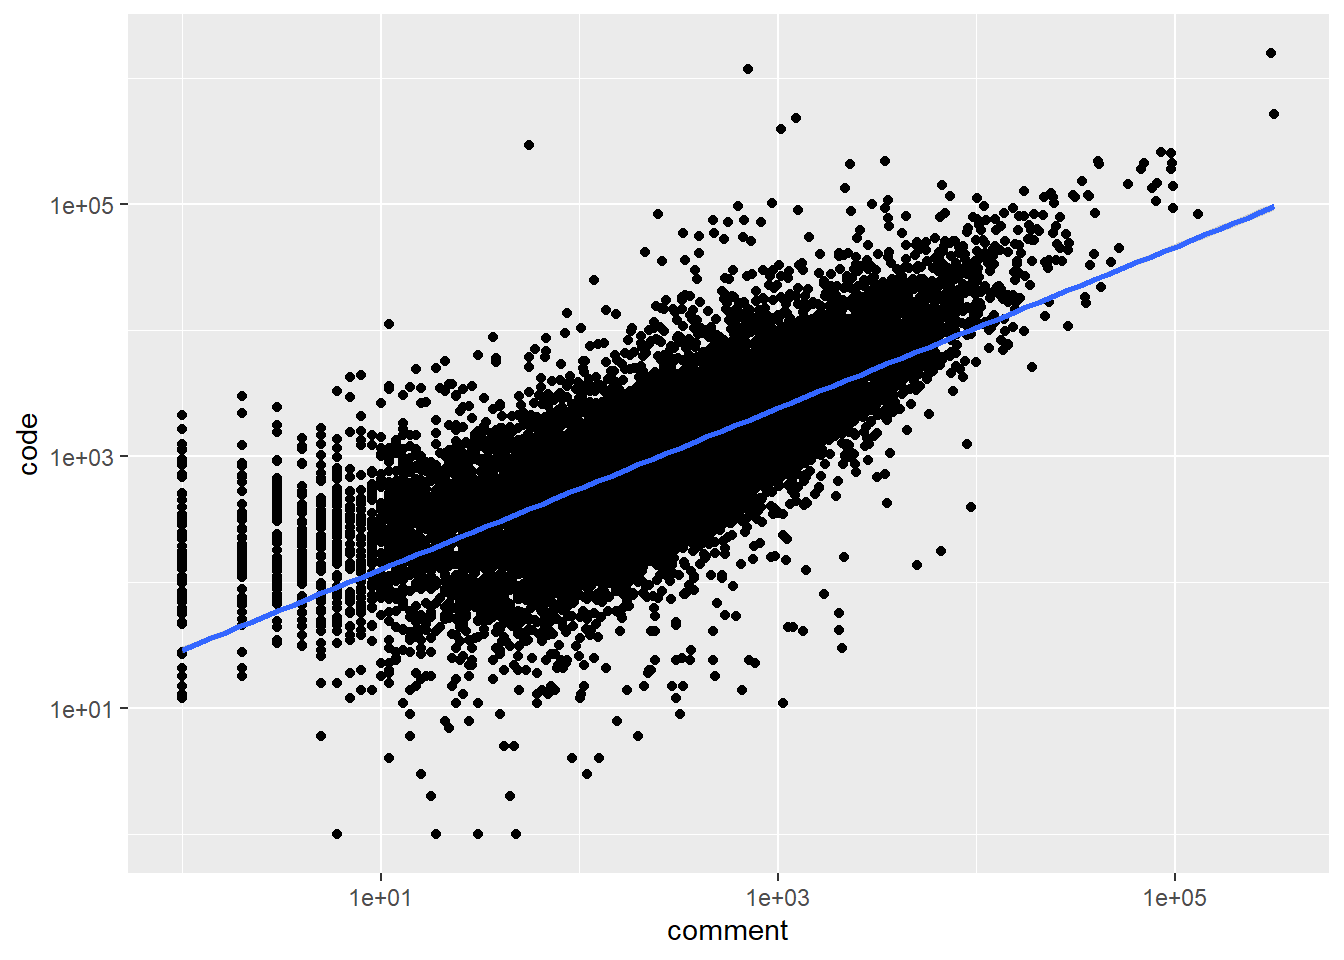
We can also see a similar trend among non-tidyverse packages, which is that there is a somewhat linear relationship among # of code lines and # of comment lines.
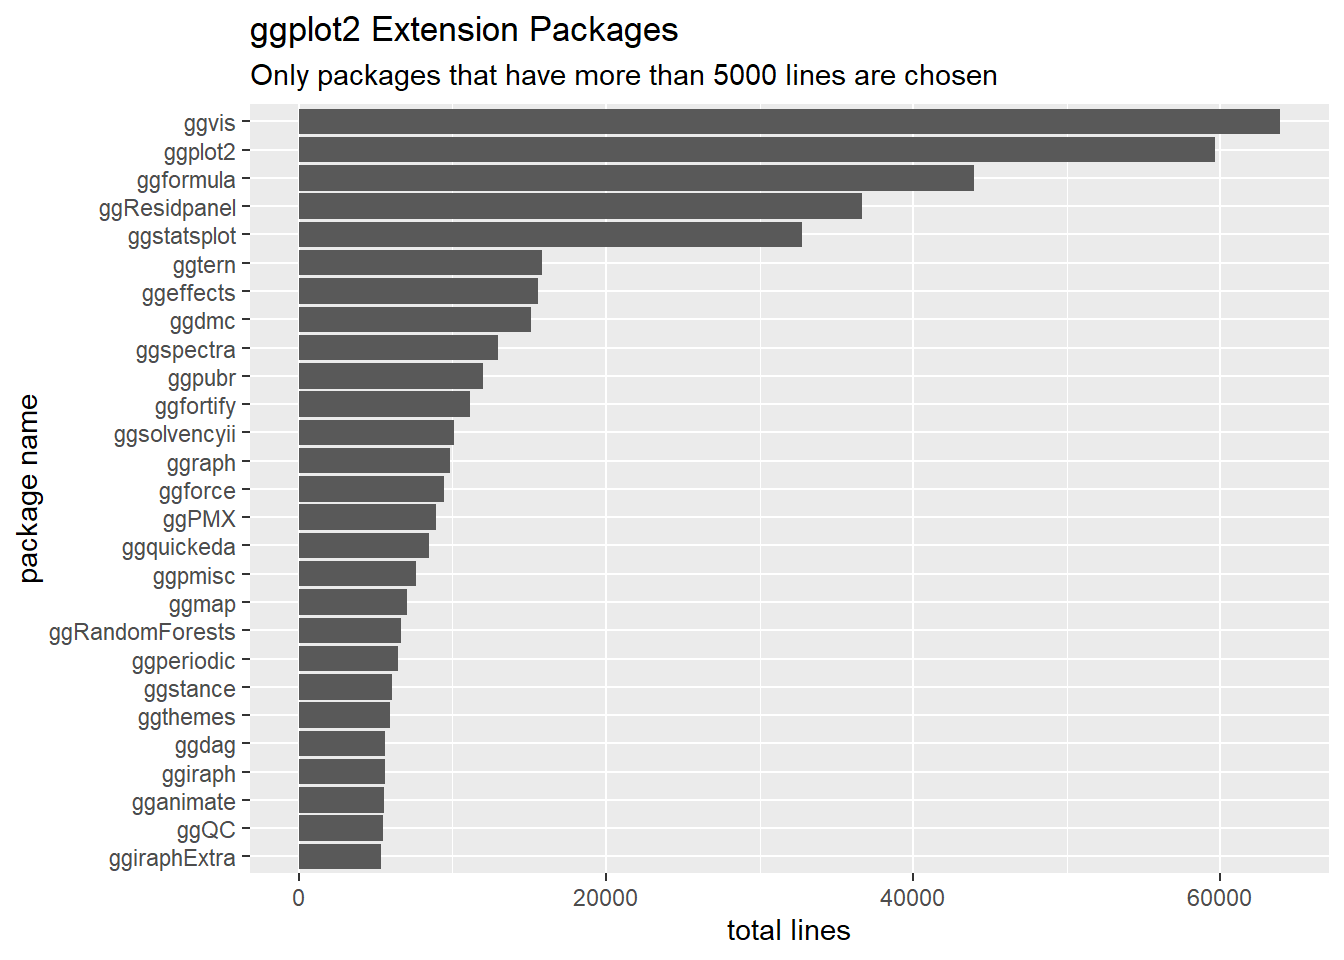
ggplot2 Extension Packages
In this section, I am extracting all packages whose name starts with gg. Althought extracting package name in this way does not guarantee each package is part of ggplot2 extensions, it is the most convenient way I can think about.
cran %>%
  filter(str_detect(pkg_name, "^gg")) %>%
  group_by(pkg_name) %>%
  summarize(total_lines = sum(total_lines)) %>%
  ungroup() %>%
  filter(total_lines > 5000) %>%
  mutate(pkg_name = fct_reorder(pkg_name, total_lines)) %>%
  ggplot(aes(total_lines, pkg_name)) +
  geom_col() +
  labs(x = "total lines",
       y = "package name",
       title = "ggplot2 Extension Packages",
       subtitle = "Only packages that have more than 5000 lines are chosen")