Volcano Eruption Data Visualization
Wed, Jan 5, 2022
3-minute read
This blog post will analyze Volcano datasets provided by TidyTuesday (here is the link).
library(tidyverse)
library(lubridate)
theme_set(theme_bw())
volcano <- read_csv('https://raw.githubusercontent.com/rfordatascience/tidytuesday/master/data/2020/2020-05-12/volcano.csv')
eruptions <- read_csv('https://raw.githubusercontent.com/rfordatascience/tidytuesday/master/data/2020/2020-05-12/eruptions.csv')%>%
mutate(start_time = make_date(start_year, start_month, start_day),
end_time = make_date(end_year, end_month, end_day),
eruption_days = as.integer(end_time - start_time))
events <- read_csv('https://raw.githubusercontent.com/rfordatascience/tidytuesday/master/data/2020/2020-05-12/events.csv')
tree_rings <- read_csv('https://raw.githubusercontent.com/rfordatascience/tidytuesday/master/data/2020/2020-05-12/tree_rings.csv')
sulfur <- read_csv('https://raw.githubusercontent.com/rfordatascience/tidytuesday/master/data/2020/2020-05-12/sulfur.csv')Making a map on the valcano locations
eruptions %>%
  ggplot(aes(longitude, latitude, color = eruption_category)) +
  geom_point(aes(size = as.integer(eruption_days))) +
  geom_text(aes(label = volcano_name), hjust = 1, vjust = 1, check_overlap = T) +
  borders("world") +
  theme_void() +
  theme(plot.title = element_text(size = 18)) +
  labs(size = "days of eruption",
       color = "eruption category",
title = "Volcanos and their eruption info") 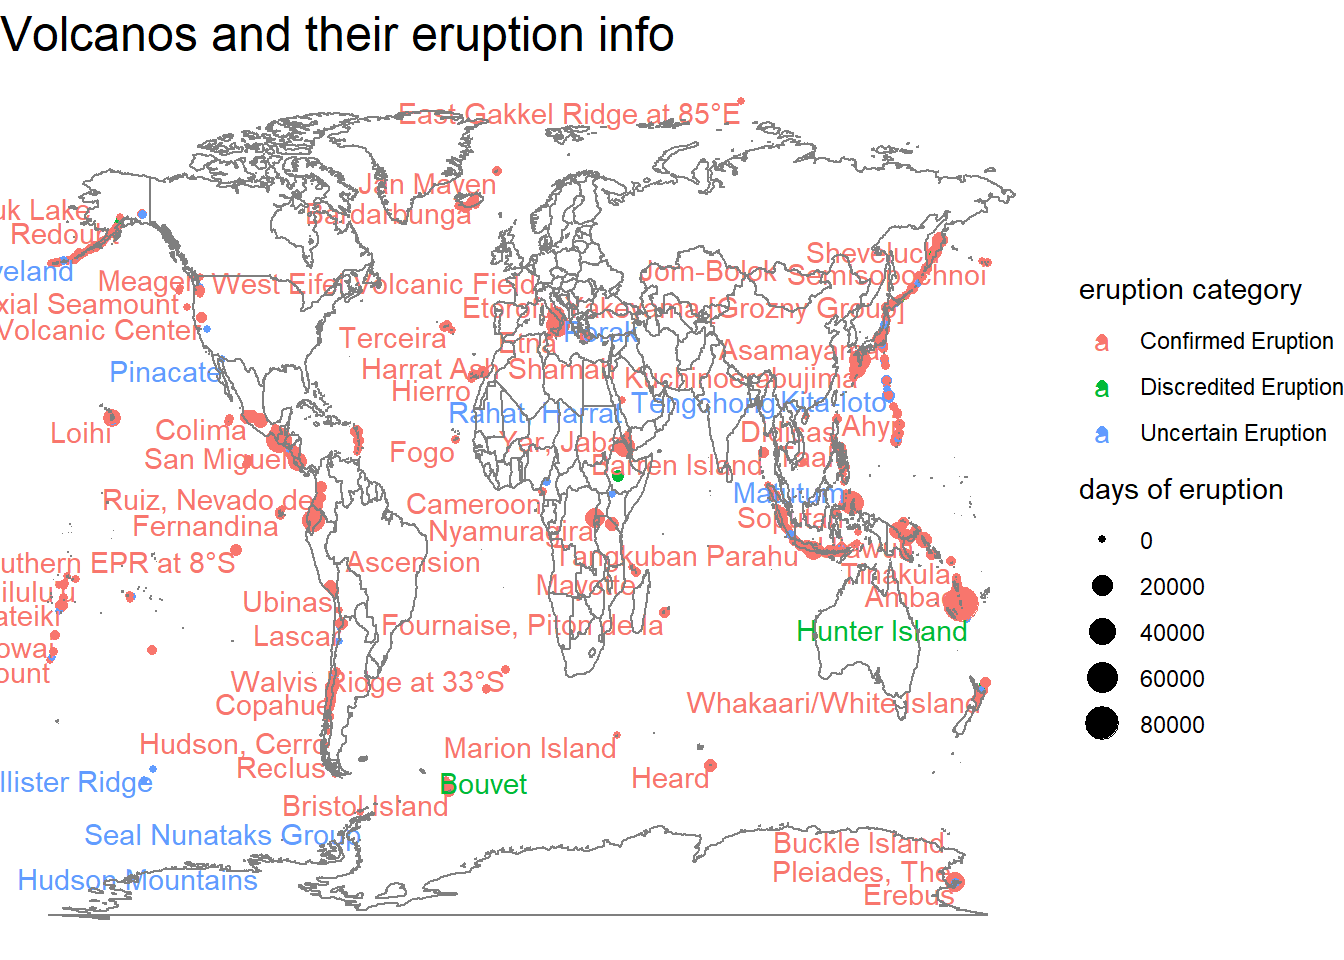
When did eruptions happen the most?
eruptions %>%
  count(start_year) %>%
  filter(start_year > 0) %>%
  ggplot(aes(start_year, n)) +
  geom_point() +
  geom_smooth(se = F) +
  labs(x = "eruption year",
y = "# of eruptions") 
It seems like the volcano activities have taken place much more in the last 500 years.
eruptions %>%
  count(start_year) %>%
  filter(start_year > 1500) %>%
  ggplot(aes(start_year, n)) +
  geom_point() +
  geom_smooth(se = F) +
  labs(x = "eruption year",
y = "# of eruptions") 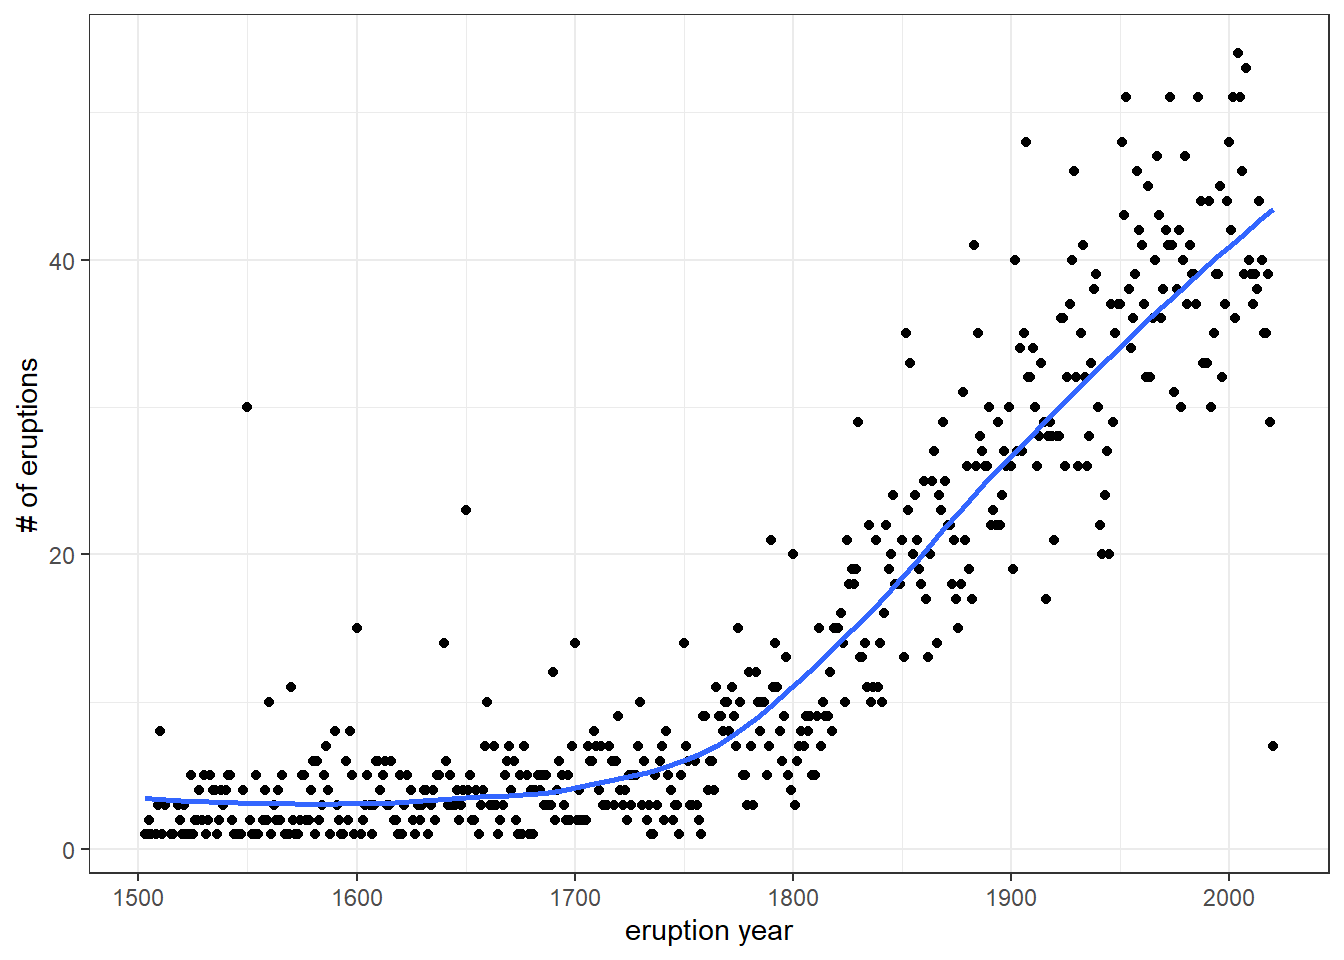
I am not sure if the increased number of volcano eruptions had anything to do with industry revoluation.
Join volcano and eruptions together
eruptions_volcano_joined <- eruptions %>%
  left_join(volcano, by = c("volcano_number", "volcano_name", "latitude", "longitude"))

eruptions_volcano_joined %>%
  mutate(subregion = fct_lump(subregion, n = 20),
         country = fct_lump(country, n = 10)) %>%
  filter(subregion != "Other") %>%
  mutate(subregion = fct_reorder(subregion, elevation, median)) %>%
  ggplot(aes(elevation, subregion, fill = country)) +
  geom_boxplot() +
  labs(title = "Top 20 subregions' volcano elevation")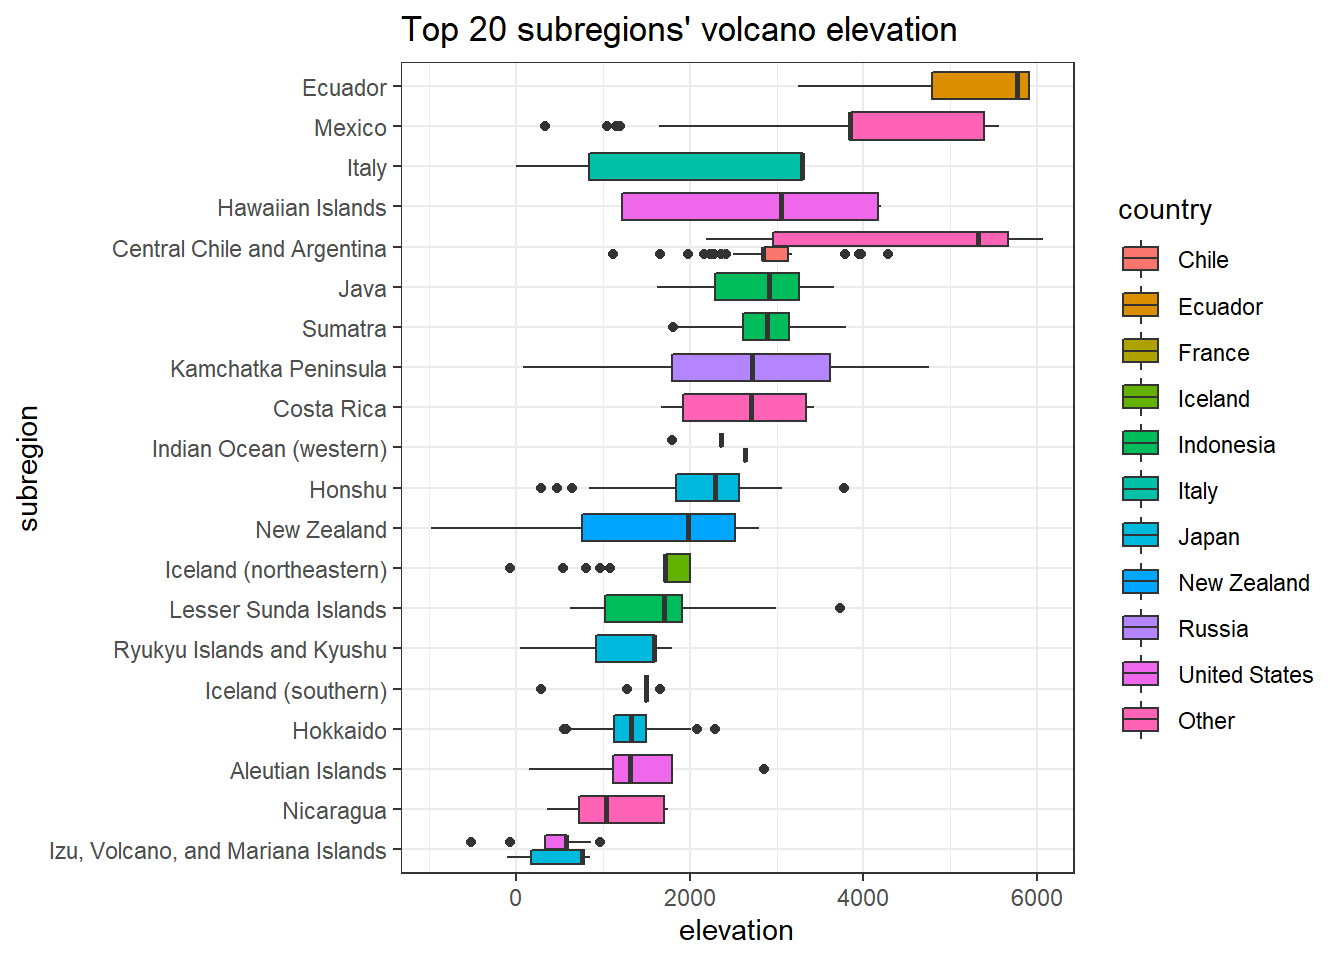
The most historically active volcanos
eruptions_volcano_joined %>%
  mutate(country = fct_lump(country, 10)) %>%
  group_by(volcano_name, country) %>%
  summarize(n = n(),
            sum_days = sum(eruption_days, na.rm = T)) %>%
  arrange(desc(sum_days)) %>%
  ggplot(aes(n, sum_days, color = country)) +
  geom_point() +
  geom_text(aes(label = volcano_name), hjust = 1, vjust = 1, check_overlap = T) +
  scale_y_log10(label = scales::comma) +
  scale_x_log10() +
  labs(x = "# of eruptions",
       y = "# of eruption days in total")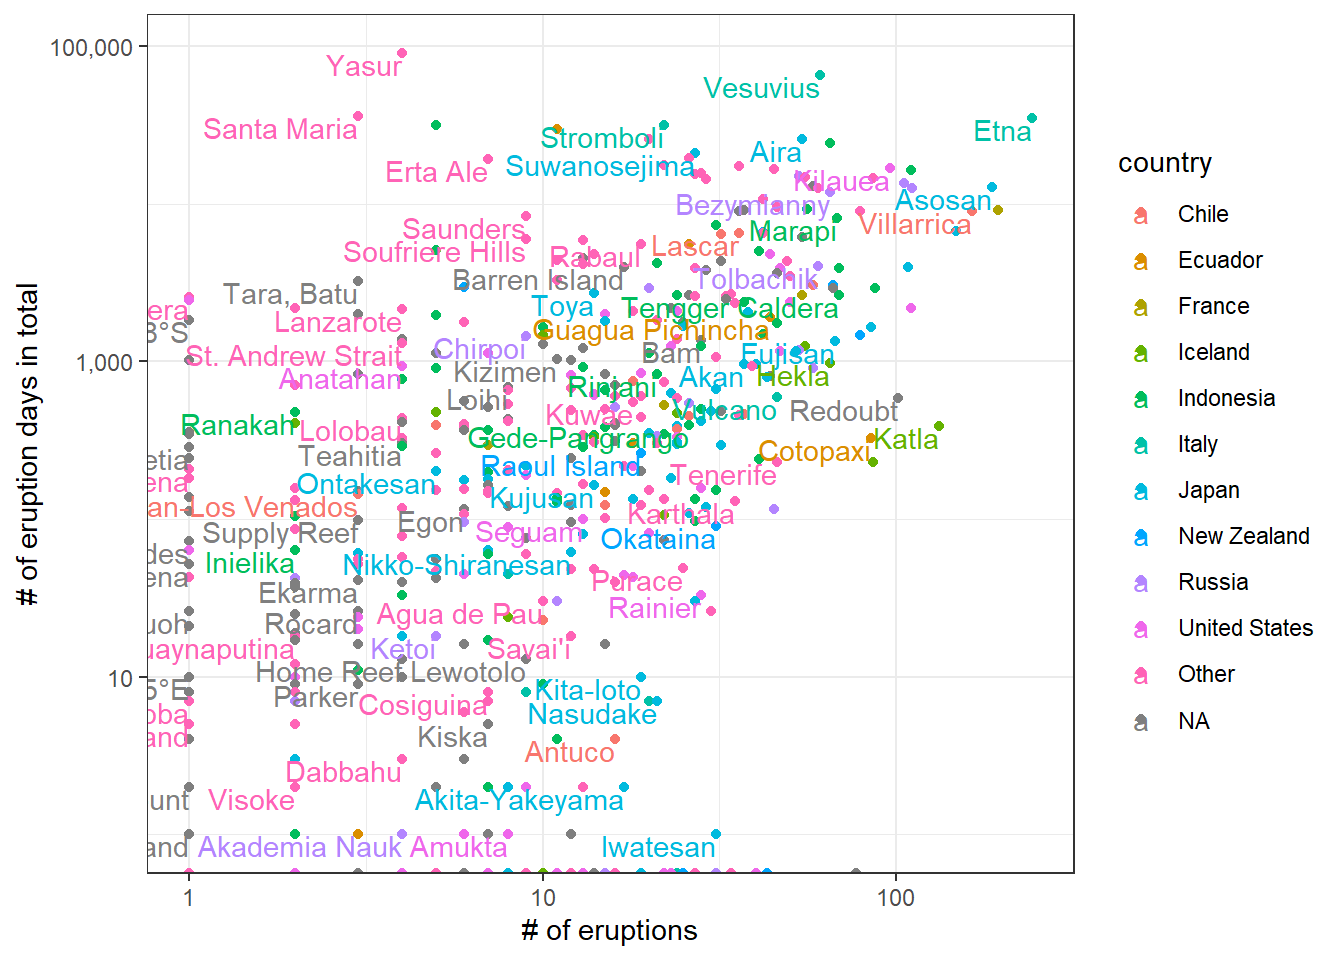
Working on tree_rings
tree_rings %>%
  pivot_longer(cols = c(n_tree, europe_temp_index)) %>%
  ggplot(aes(year, value, color = name)) +
  geom_line() +
  geom_smooth() +
  facet_wrap(~name, ncol = 1) +
  theme(legend.position = "none")
Working on sulfur
sulfur %>%
  pivot_longer(cols = c(neem, wdc)) %>%
  ggplot(aes(year, value, color = name)) +
  geom_line() +
  scale_y_log10() +
  facet_wrap(~name, ncol = 1) +
  labs(color = "variable") +
  theme(legend.position = "none")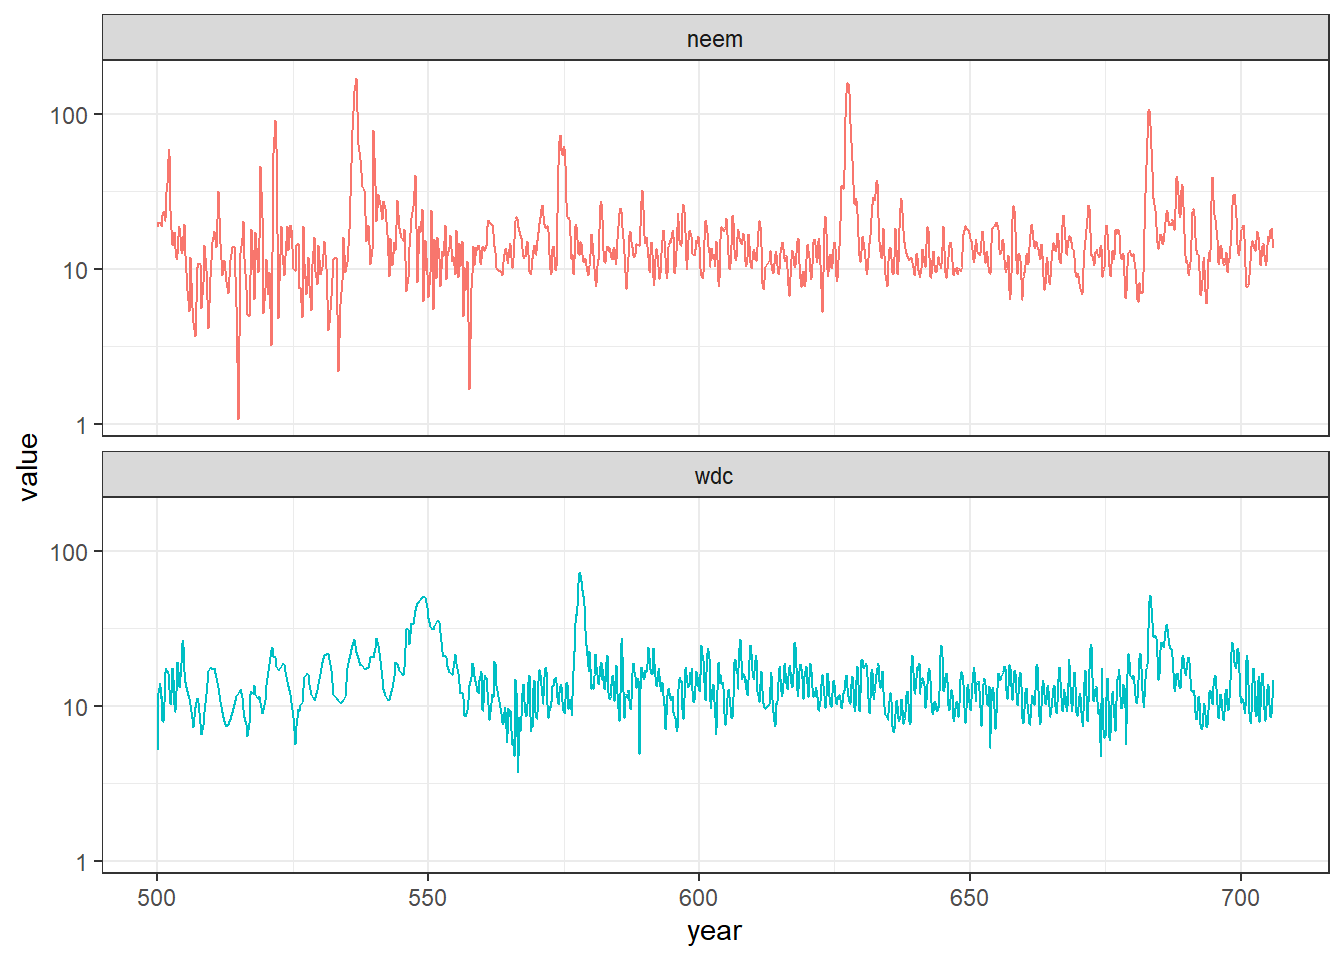
Working on events
events %>%
  mutate(event_type = str_remove(event_type, "\\s?\\(.+")) %>%
  count(volcano_name, event_type, sort = T) %>%
  head(100) %>%
  mutate(volcano_name = fct_reorder(volcano_name, n, sum)) %>%
  ggplot(aes(n, volcano_name, fill = event_type)) +
  geom_col() +
  labs(x = "# of eruptions",
       y = "volcano",
       fill = "event type",
       title = "Volcanos and their event types")