U.S. Post Office Data Visualization
Thu, Mar 24, 2022
4-minute read
In this blog post, I will analyze the post offices in the U.S. in terms of when they were established and when they were discontinued.
library(tidyverse)
library(geofacet)
library(tidytext)
theme_set(theme_bw())
post_offices <- read_csv('https://raw.githubusercontent.com/rfordatascience/tidytuesday/master/data/2021/2021-04-13/post_offices.csv') %>%
filter(longitude < 100,
established > 1000,
established < discontinued,
discontinued < 2020) %>%
select(-contains("gnis"), -alt_name, -orig_name) %>%
mutate(name = str_to_title(name),
est_decade = 10 * (established %/% 10),
dis_decade = 10 * (discontinued %/% 10))
post_offices ## # A tibble: 82,173 x 17
## name state county1 county2 county3 orig_county established discontinued
## <chr> <chr> <chr> <lgl> <lgl> <chr> <dbl> <dbl>
## 1 Aaron MO BATES NA NA Bates 1895 1933
## 2 Aaron GA BULLOCH NA NA Bulloch 1909 1920
## 3 Aaron SC ANDERSON NA NA Anderson 1892 1899
## 4 Abadyl MO CHRISTI~ NA NA Christian 1895 1919
## 5 Abattis MO WARREN NA NA Warren 1878 1904
## 6 Abaugh AR NEWTON NA NA Newton 1928 1954
## 7 Abba GA IRWIN NA NA Irwin 1884 1954
## 8 Abbey AL FRANKLIN NA NA Franklin 1898 1902
## 9 Abbie Joe LA BEAUREG~ NA NA Beauregard 1918 1925
## 10 Abbot ME PISCATA~ NA NA Piscataqui~ 1825 1912
## # ... with 82,163 more rows, and 9 more variables: continuous <lgl>,
## # stamp_index <dbl>, id <dbl>, coordinates <lgl>, duration <dbl>,
## # latitude <dbl>, longitude <dbl>, est_decade <dbl>, dis_decade <dbl>The post office map:
post_offices %>%
  ggplot(aes(longitude, latitude, color = state)) +
  geom_point(show.legend = F) +
  theme_void() +
  labs(title = "The Locations of Post Offices")
Century-wise post office maps:
post_offices %>%
  mutate(century = 100 * (established %/% 100),
         century = paste("Century", century)) %>%
  mutate(timeline = case_when(established < 1800 ~ "Before 1800",
                              established >= 1800 & established <= 1849 ~ "Between 1800 and 1849",
                              established >= 1850 & established <= 1899 ~ "Between 1850 and 1899",
                              established >= 1900 ~ "After 1900"),
         timeline = fct_reorder(timeline, parse_number(timeline))) %>%
  ggplot(aes(longitude, latitude, color = state)) +
  geom_point(show.legend = F) +
  theme_void() +
  labs(title = "The Locations of Post Offices per Century") +
  theme(strip.text = element_text(size = 15),
        plot.title = element_text(size = 18)) +
  coord_fixed() +
facet_wrap(~timeline, ncol = 2) 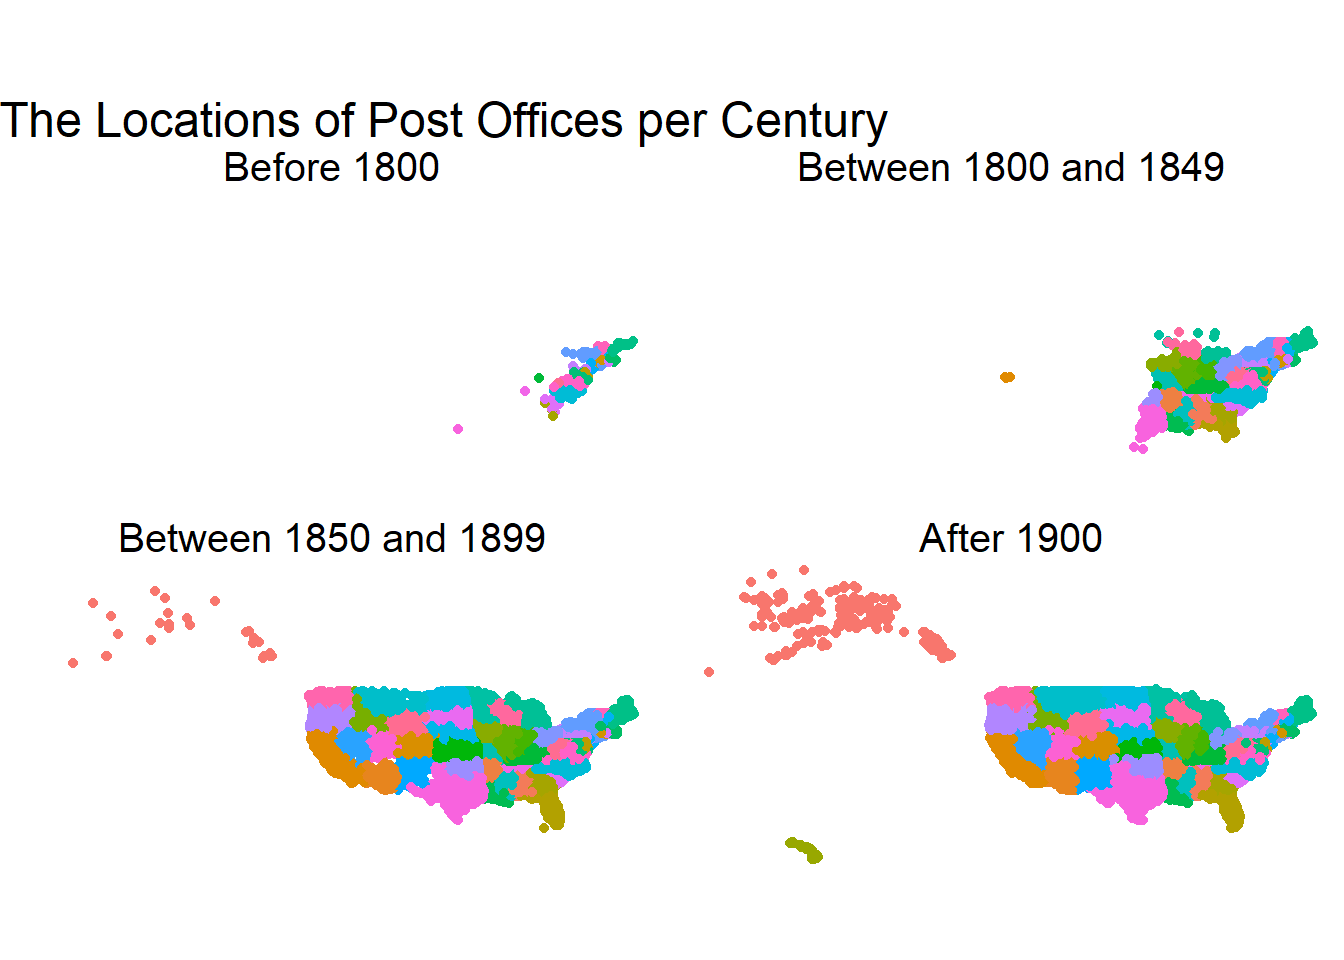
The maps above show how America progressed on its area based on where the post offices were located.
Top 5 post offices with the longest duration:
post_offices %>%
  group_by(state) %>%
  slice_max(duration, n = 5, with_ties = F) %>%
  ungroup() %>%
  mutate(name = reorder_within(name, established, state)) %>%
  ggplot(aes(y = name, color = state)) +
  geom_errorbarh(aes(xmin = established,
                     xmax = discontinued),
                 height = 0.2) +
  facet_geo(~state, scale = "free_y") +
  scale_y_reordered() +
  theme(axis.text.x = element_text(angle = 90),
        legend.position = "none") +
  labs(y = "post office name",
       title = "Top 5 Longest Used Post Offices per State")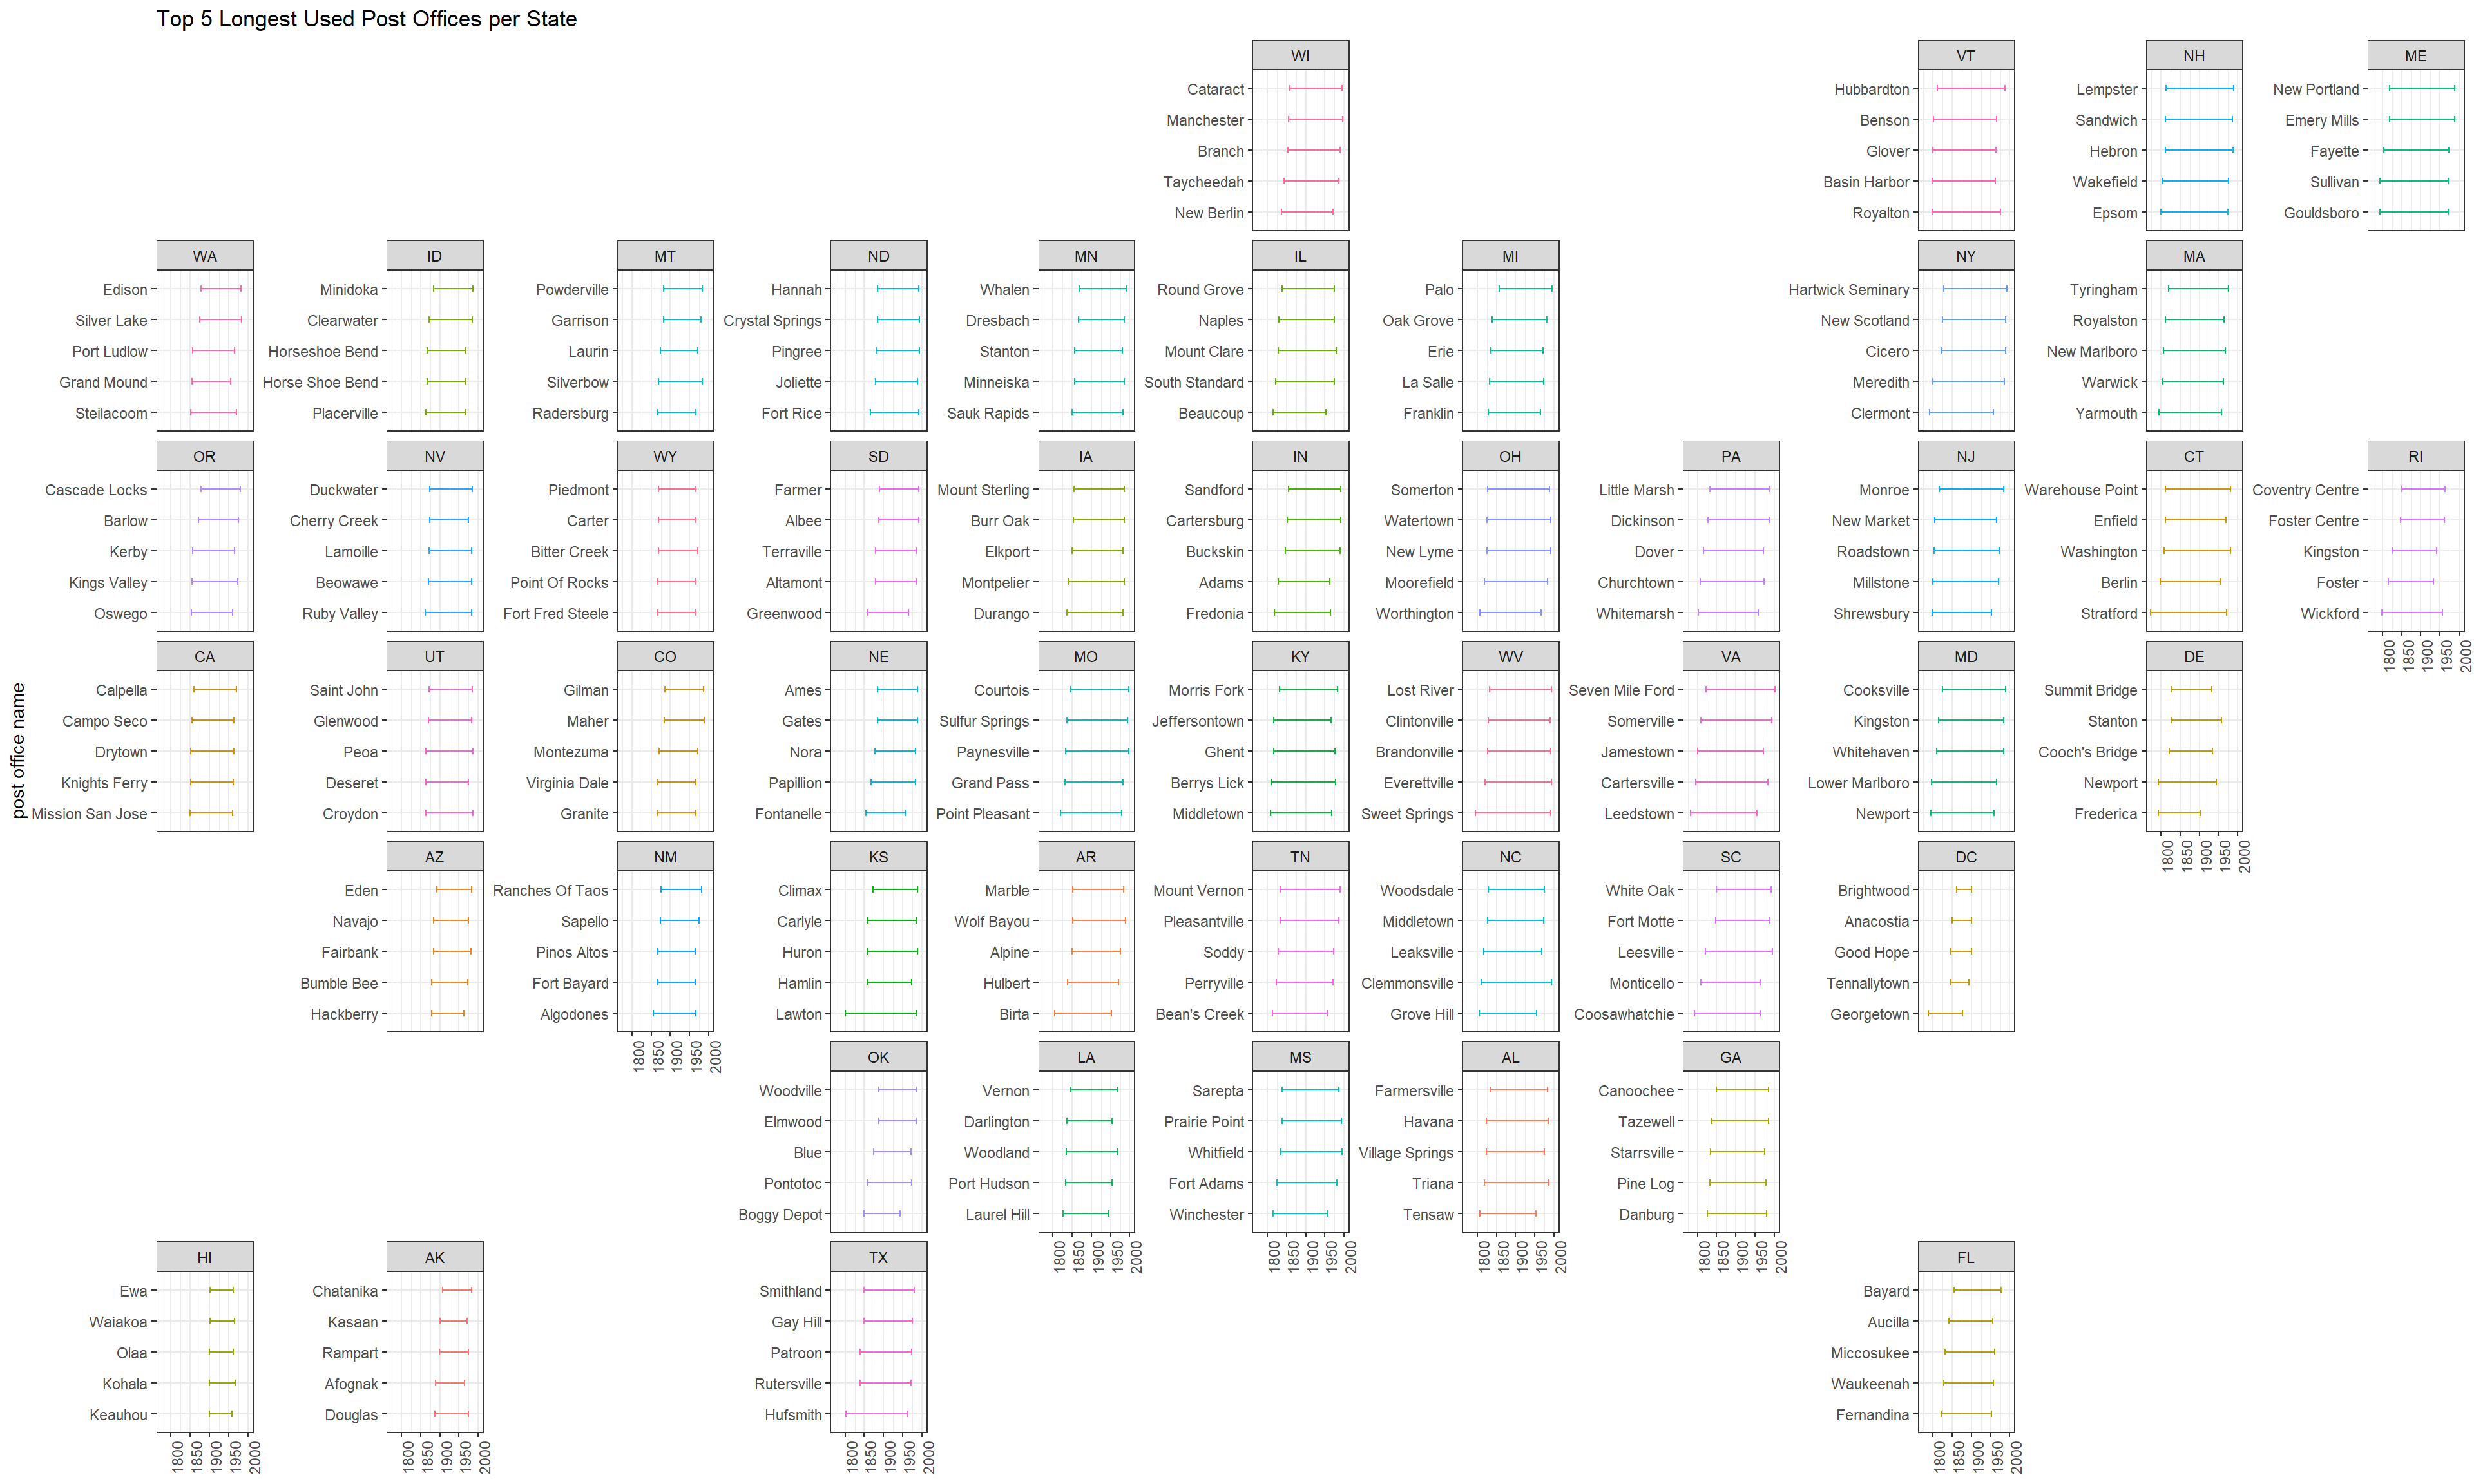
Does duration have anything to do with the established decade?
post_offices  %>%
  ggplot(aes(est_decade, duration, group = est_decade, fill = factor(est_decade), color = factor(est_decade))) +
  geom_boxplot(alpha = 0.6,
               show.legend = F) +
  scale_x_continuous(breaks = seq(1750, 2000, 20)) +
  labs(x = "established decade",
       y = "duration (in years)",
title = "How long did post office last per established decade?") 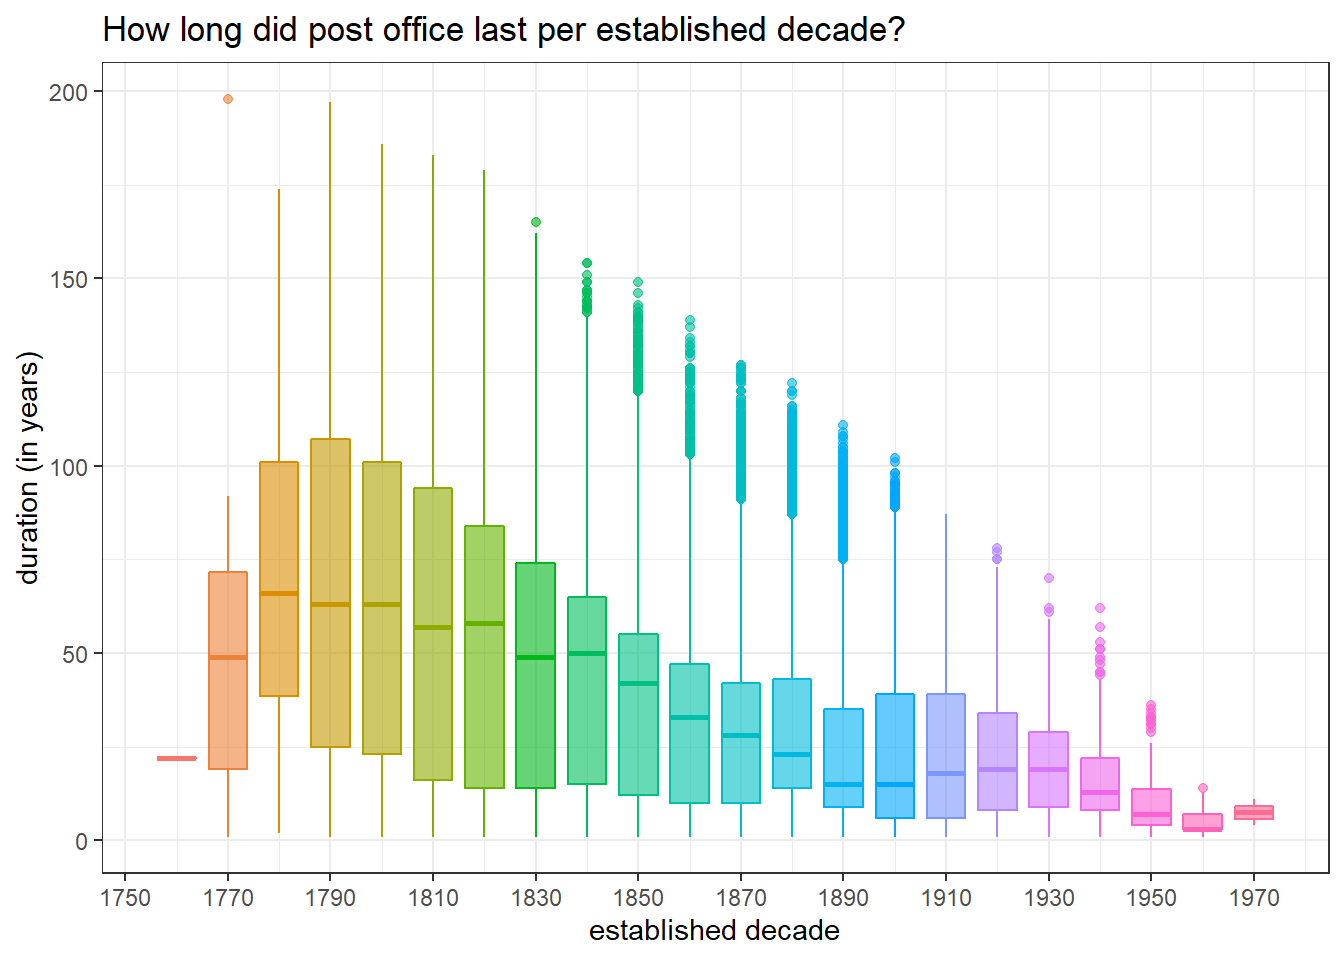
There is a slight downward trend for the duration of the post offices established in the newer era.
post_offices %>%
  group_by(state) %>%
  slice_min(established, n = 1, with_ties = F) %>%
  ungroup() %>%
  mutate(name = paste0(name, "(", state, ")"),
         name = fct_reorder(name, established)) %>%
  ggplot(aes(established, name, fill = duration)) +
  geom_col() +
  geom_text(aes(label = established),
            hjust = 0) +
  theme(axis.text.x=element_blank(),
        axis.ticks.x = element_blank()) +
  scale_fill_gradient2(low = "red",
                       mid = "pink",
                       high = "green") +
  expand_limits(x = 1940) +
  labs(x = "established year",
       y = "post office name and state",
       title = "The First Post Office and its Established Year per State")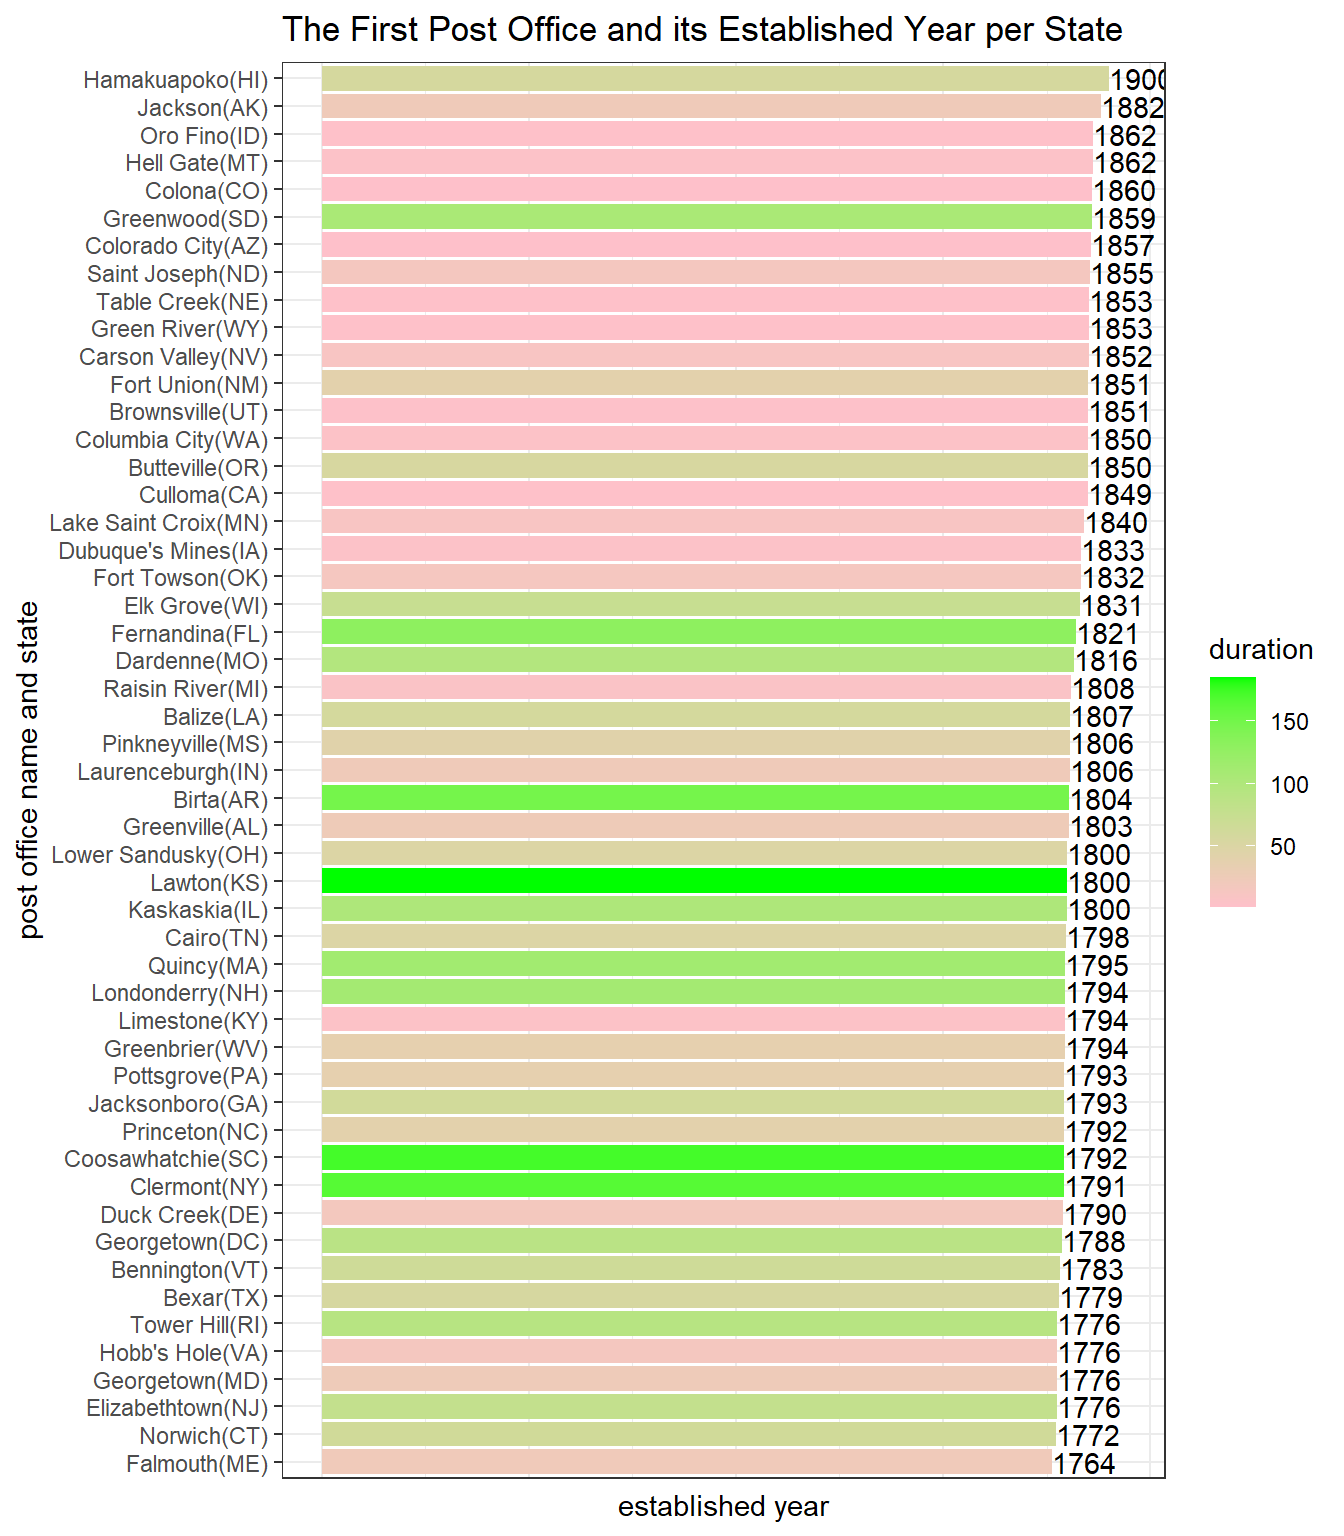
The oldest post office was established in Maine in 1764.
Number of post office established and discontinued per decade:
post_offices %>%
  group_by(est_decade) %>%
  summarize(est_num = n()) %>%
  ungroup() %>%
  full_join(post_offices %>%
              group_by(dis_decade) %>%
              summarize(dis_num = n()) %>%
              ungroup(),
            by = c("est_decade" = "dis_decade")) %>%
  rename(`Established Number` = est_num,
         `Discontinued Number` = dis_num) %>%
  pivot_longer(2:3) %>%
  ggplot(aes(est_decade, value, color = name)) +
  geom_line() +
  geom_point() +
  labs(x = "decade",
       y = NULL,
       color = NULL,
       title = "# of Post Offices Established and Discontinued per Decade")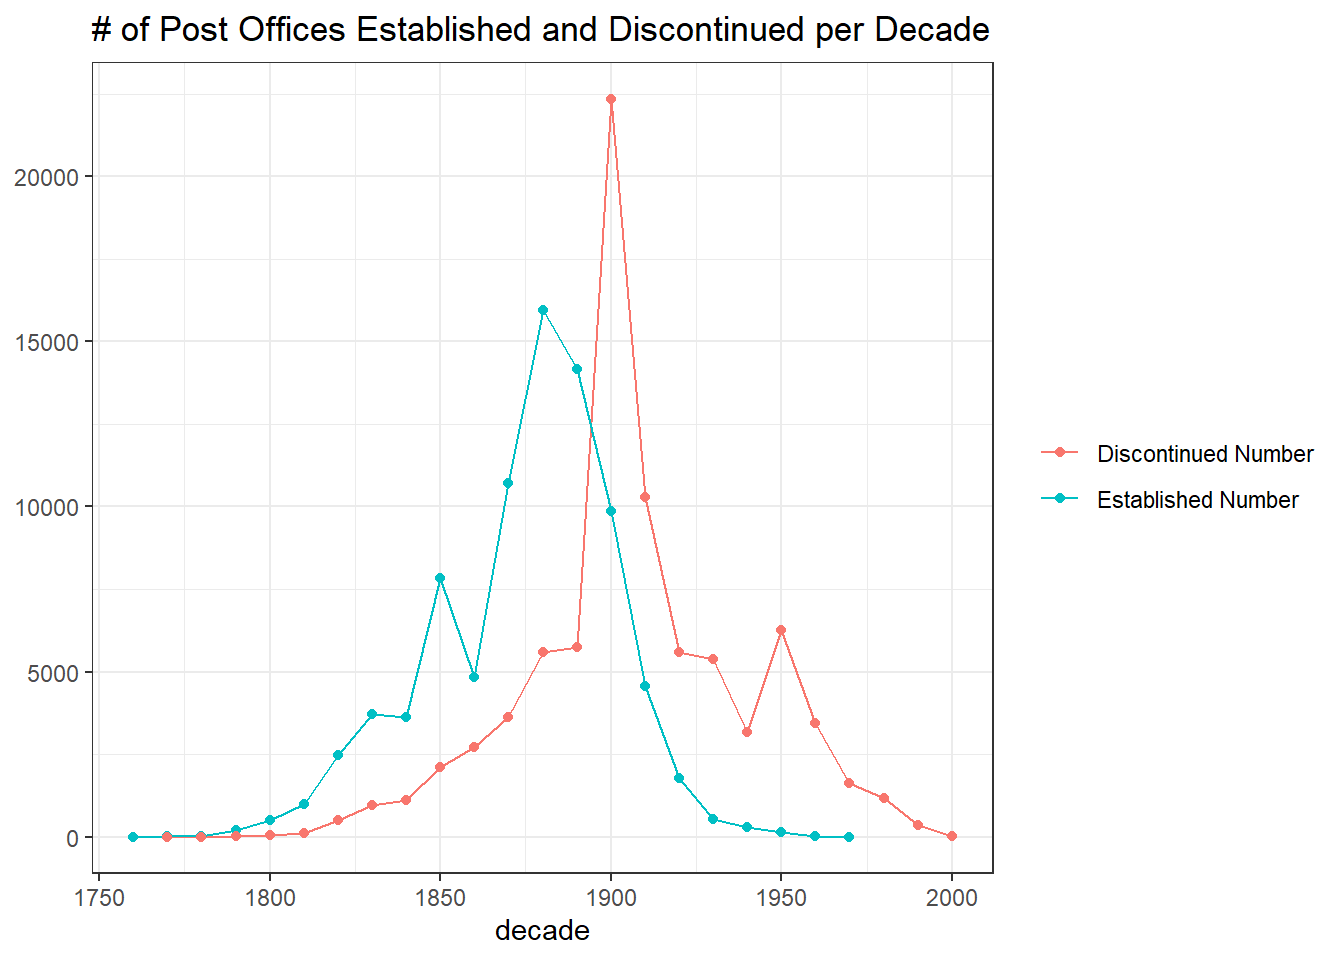
post_offices %>%
  group_by(established) %>%
  summarize(est_num = n()) %>%
  ungroup() %>%
  full_join(post_offices %>%
              group_by(discontinued) %>%
              summarize(dis_num = n()) %>%
              ungroup(),
            by = c("established" = "discontinued")) %>%
  rename(`Established Number` = est_num,
         `Discontinued Number` = dis_num) %>%
  pivot_longer(2:3) %>%
  ggplot(aes(established, value, color = name)) +
  geom_line() +
  geom_point() +
  labs(x = "year",
       y = NULL,
       color = NULL,
       title = "# of Post Offices Established and Discontinued per year")