Bootstrap and Cross-Validation Using Tidymodels
Mon, Mar 28, 2022
2-minute read
This blog post follows up Julia Silge’s penguin blog post (link). In her post, she only uses the bootstrap method, but here in this data analysis, I will use both bootstrap and 10-fold cross validation for the purposes of practicing the tidymodels meta-package.
library(tidyverse)
library(tidymodels)
library(palmerpenguins)
penguins <- penguins %>%
filter(!is.na(sex))Split the data into training and testing:
set.seed(2022)

split <- initial_split(penguins, strata = sex)
penguins_train <- training(split)
penguins_test <- testing(split)
Penguin recipe:
pen_rec <- recipe(sex ~ ., data = penguins_train) %>%
  update_role(island, year, new_role = "id")

# pen_prep <- pen_rec %>%
#   prep()

pen_mod <- logistic_reg() %>%
  set_engine("glm")
Bootstrap:
pen_boots <- bootstraps(penguins_train, times = 200)10-fold CV
pen_folds <- vfold_cv(penguins_train, v = 10)boot_wf <- workflow() %>%
add_recipe(pen_rec) %>%
add_model(pen_mod) %>%
fit_resamples(
resamples = pen_boots,
control = control_resamples(save_pred = TRUE, save_workflow = TRUE)
)boot_wf %>%
collect_metrics()## # A tibble: 2 x 6
## .metric .estimator mean n std_err .config
## <chr> <chr> <dbl> <int> <dbl> <chr>
## 1 accuracy binary 0.899 200 0.00182 Preprocessor1_Model1
## 2 roc_auc binary 0.962 200 0.00105 Preprocessor1_Model1boot_wf %>%
collect_predictions() %>%
group_by(id) %>%
roc_curve(sex, .pred_female) %>%
ungroup() %>%
ggplot(aes(1-specificity, sensitivity, color = id)) +
geom_path(show.legend = F, alpha = 0.5, size = 1) 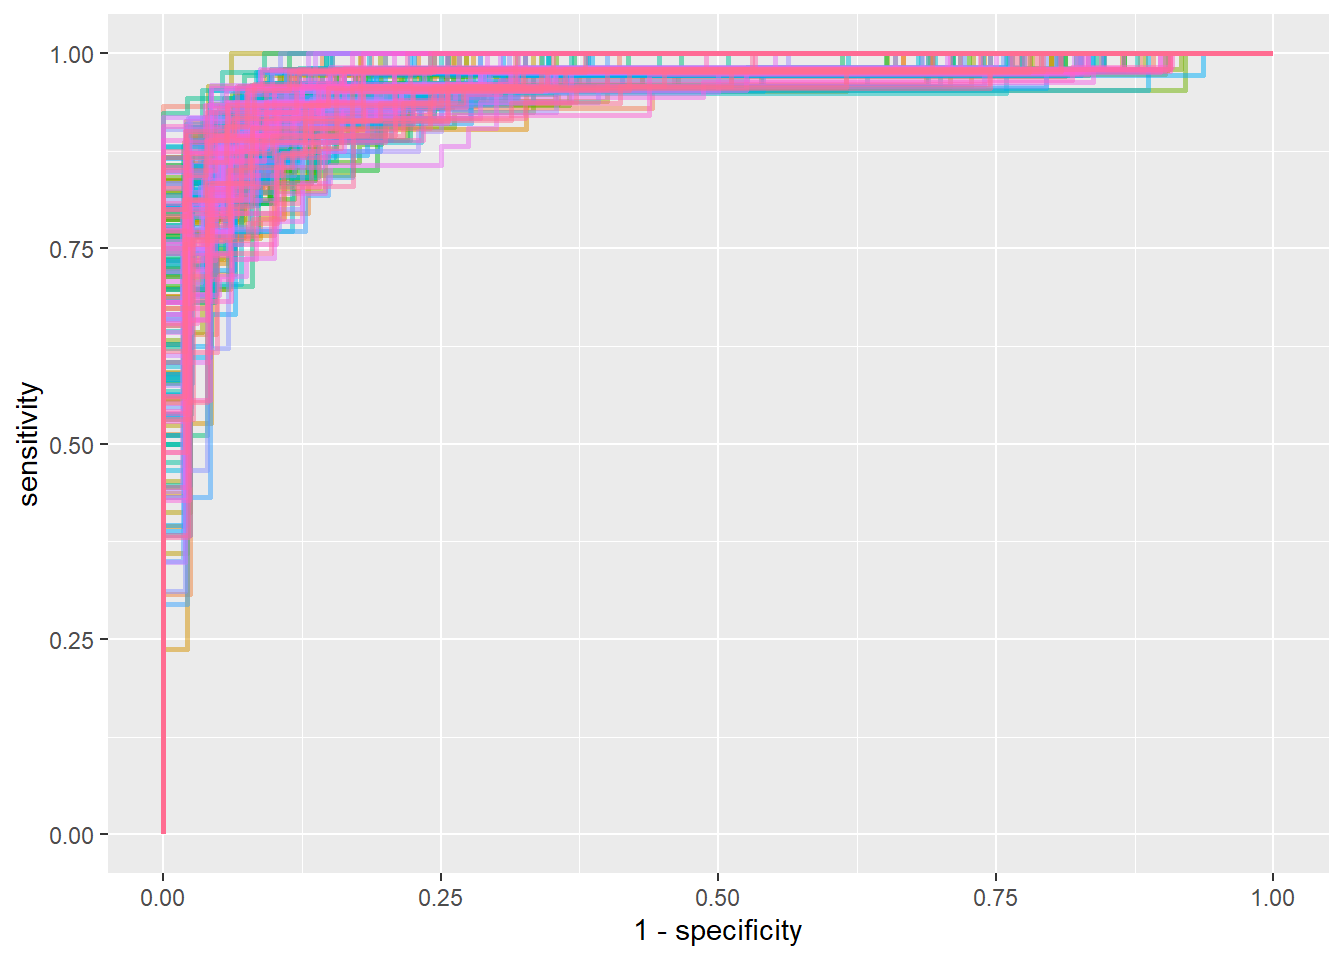
cv_wf <- workflow() %>%
  add_recipe(pen_rec) %>%
  add_model(pen_mod) %>%
  fit_resamples(
    resamples = pen_folds,
    control = control_resamples(save_pred = TRUE, save_workflow = TRUE)
  )
cv_wf %>%
collect_metrics()## # A tibble: 2 x 6
## .metric .estimator mean n std_err .config
## <chr> <chr> <dbl> <int> <dbl> <chr>
## 1 accuracy binary 0.908 10 0.0198 Preprocessor1_Model1
## 2 roc_auc binary 0.964 10 0.0137 Preprocessor1_Model1cv_wf %>%
collect_predictions() %>%
group_by(id) %>%
roc_curve(sex, .pred_female) %>%
ungroup() %>%
ggplot(aes(1 - specificity, sensitivity, color = id)) +
geom_path(show.legend = F, alpha = 0.6, size = 1) +
coord_equal()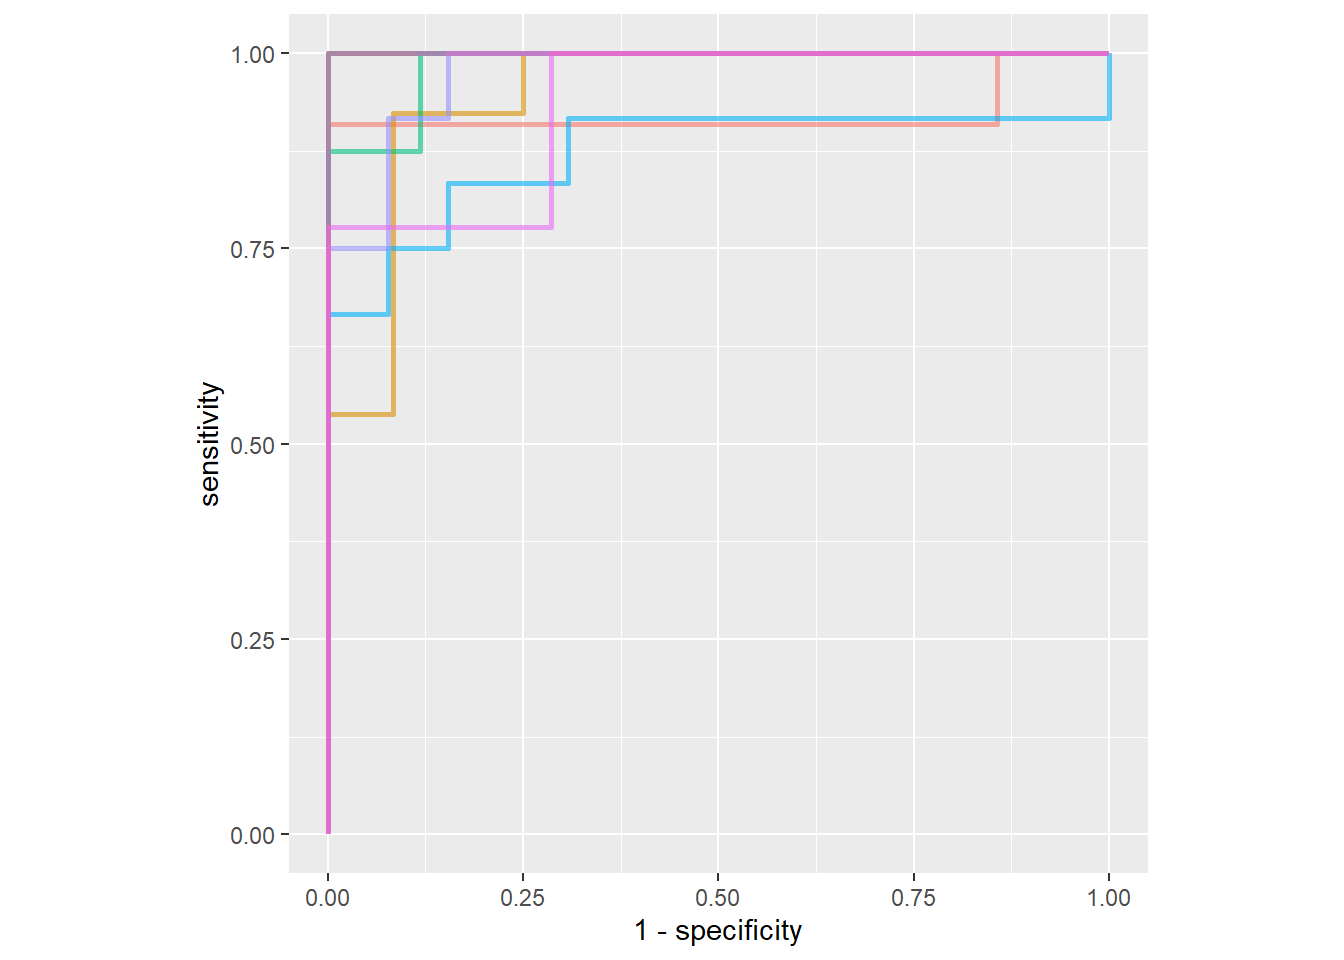
It seems like cross validation performs slightly better than bootstrap.
Without resampling, let’s see how it performs:
penguin_fit <- workflow() %>%
  add_model(pen_mod) %>%
  add_recipe(pen_rec) %>%
  fit(penguins_train)

penguin_fit %>%
  predict(penguins_train) %>%
  bind_cols(penguins_train) %>%
  metric_set(accuracy, sensitivity, specificity)(truth = sex, estimate = .pred_class)
## # A tibble: 3 x 3
## .metric .estimator .estimate
## <chr> <chr> <dbl>
## 1 accuracy binary 0.924
## 2 sensitivity binary 0.919
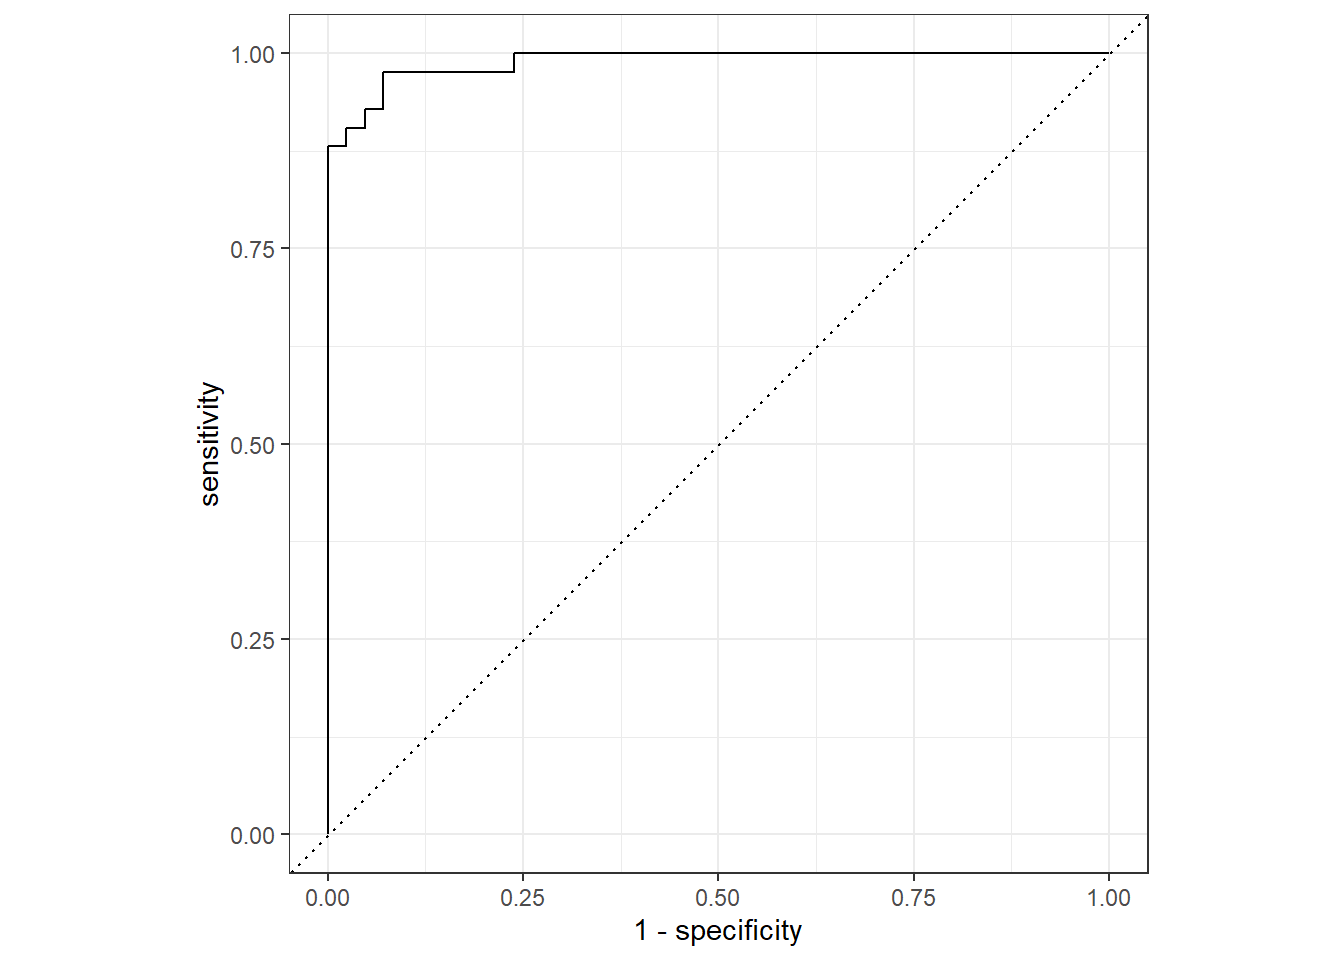
## 3 specificity binary 0.929penguin_fit %>%
predict(penguins_train, type = "prob") %>%
bind_cols(penguins_train) %>%
roc_curve(sex, .pred_female) %>%
autoplot() 
Testing the model:
penguin_fit %>%
  predict(penguins_test) %>%
  bind_cols(penguins_test) %>%
  accuracy(sex, .pred_class)
## # A tibble: 1 x 3
## .metric .estimator .estimate
## <chr> <chr> <dbl>
## 1 accuracy binary 0.929penguin_fit %>%
predict(penguins_test, type = "prob") %>%
bind_cols(penguins_test) %>%
roc_curve(sex, .pred_female) %>%
autoplot()