Robustness Auditing of Observational Findings: Evidence from 51.9 Million Job Postings
Contents 7 sections
A corpus of 51,864,055 crawled LinkedIn job postings, covering 23,970,734 distinct adverts across six monthly snapshots from February to July 2026, produces statistically significant results almost on demand. With cells of that size, a difference of a tenth of a percentage point clears any conventional threshold. The interesting question is therefore not whether a pattern is significant but whether it is the pattern one believes it to be, and answering that turned out to require far more work than finding the patterns did.
An earlier post established how artificial intelligence is counted in this corpus and what the count does over the window. This post reports what happened when the resulting claims were subjected to a systematic audit: a sequence of falsification tests applied to every headline result, including the ones I had already published. The artificial-intelligence workstream’s own register of superseded results now runs to twenty-nine entries. The account below is organised around the specific tests that removed them, because the tests generalise and the individual claims do not.
Adding a control is not a neutral act
The corpus’s most durable finding is that vocabulary about artificial intelligence grew faster in senior job adverts than in junior ones over the window, measured within the same employer and the same occupation code. The obvious threat is that senior adverts simply say more of everything, so the comparison should hold constant how much an advert says. Figure 1 shows what happens when it does.
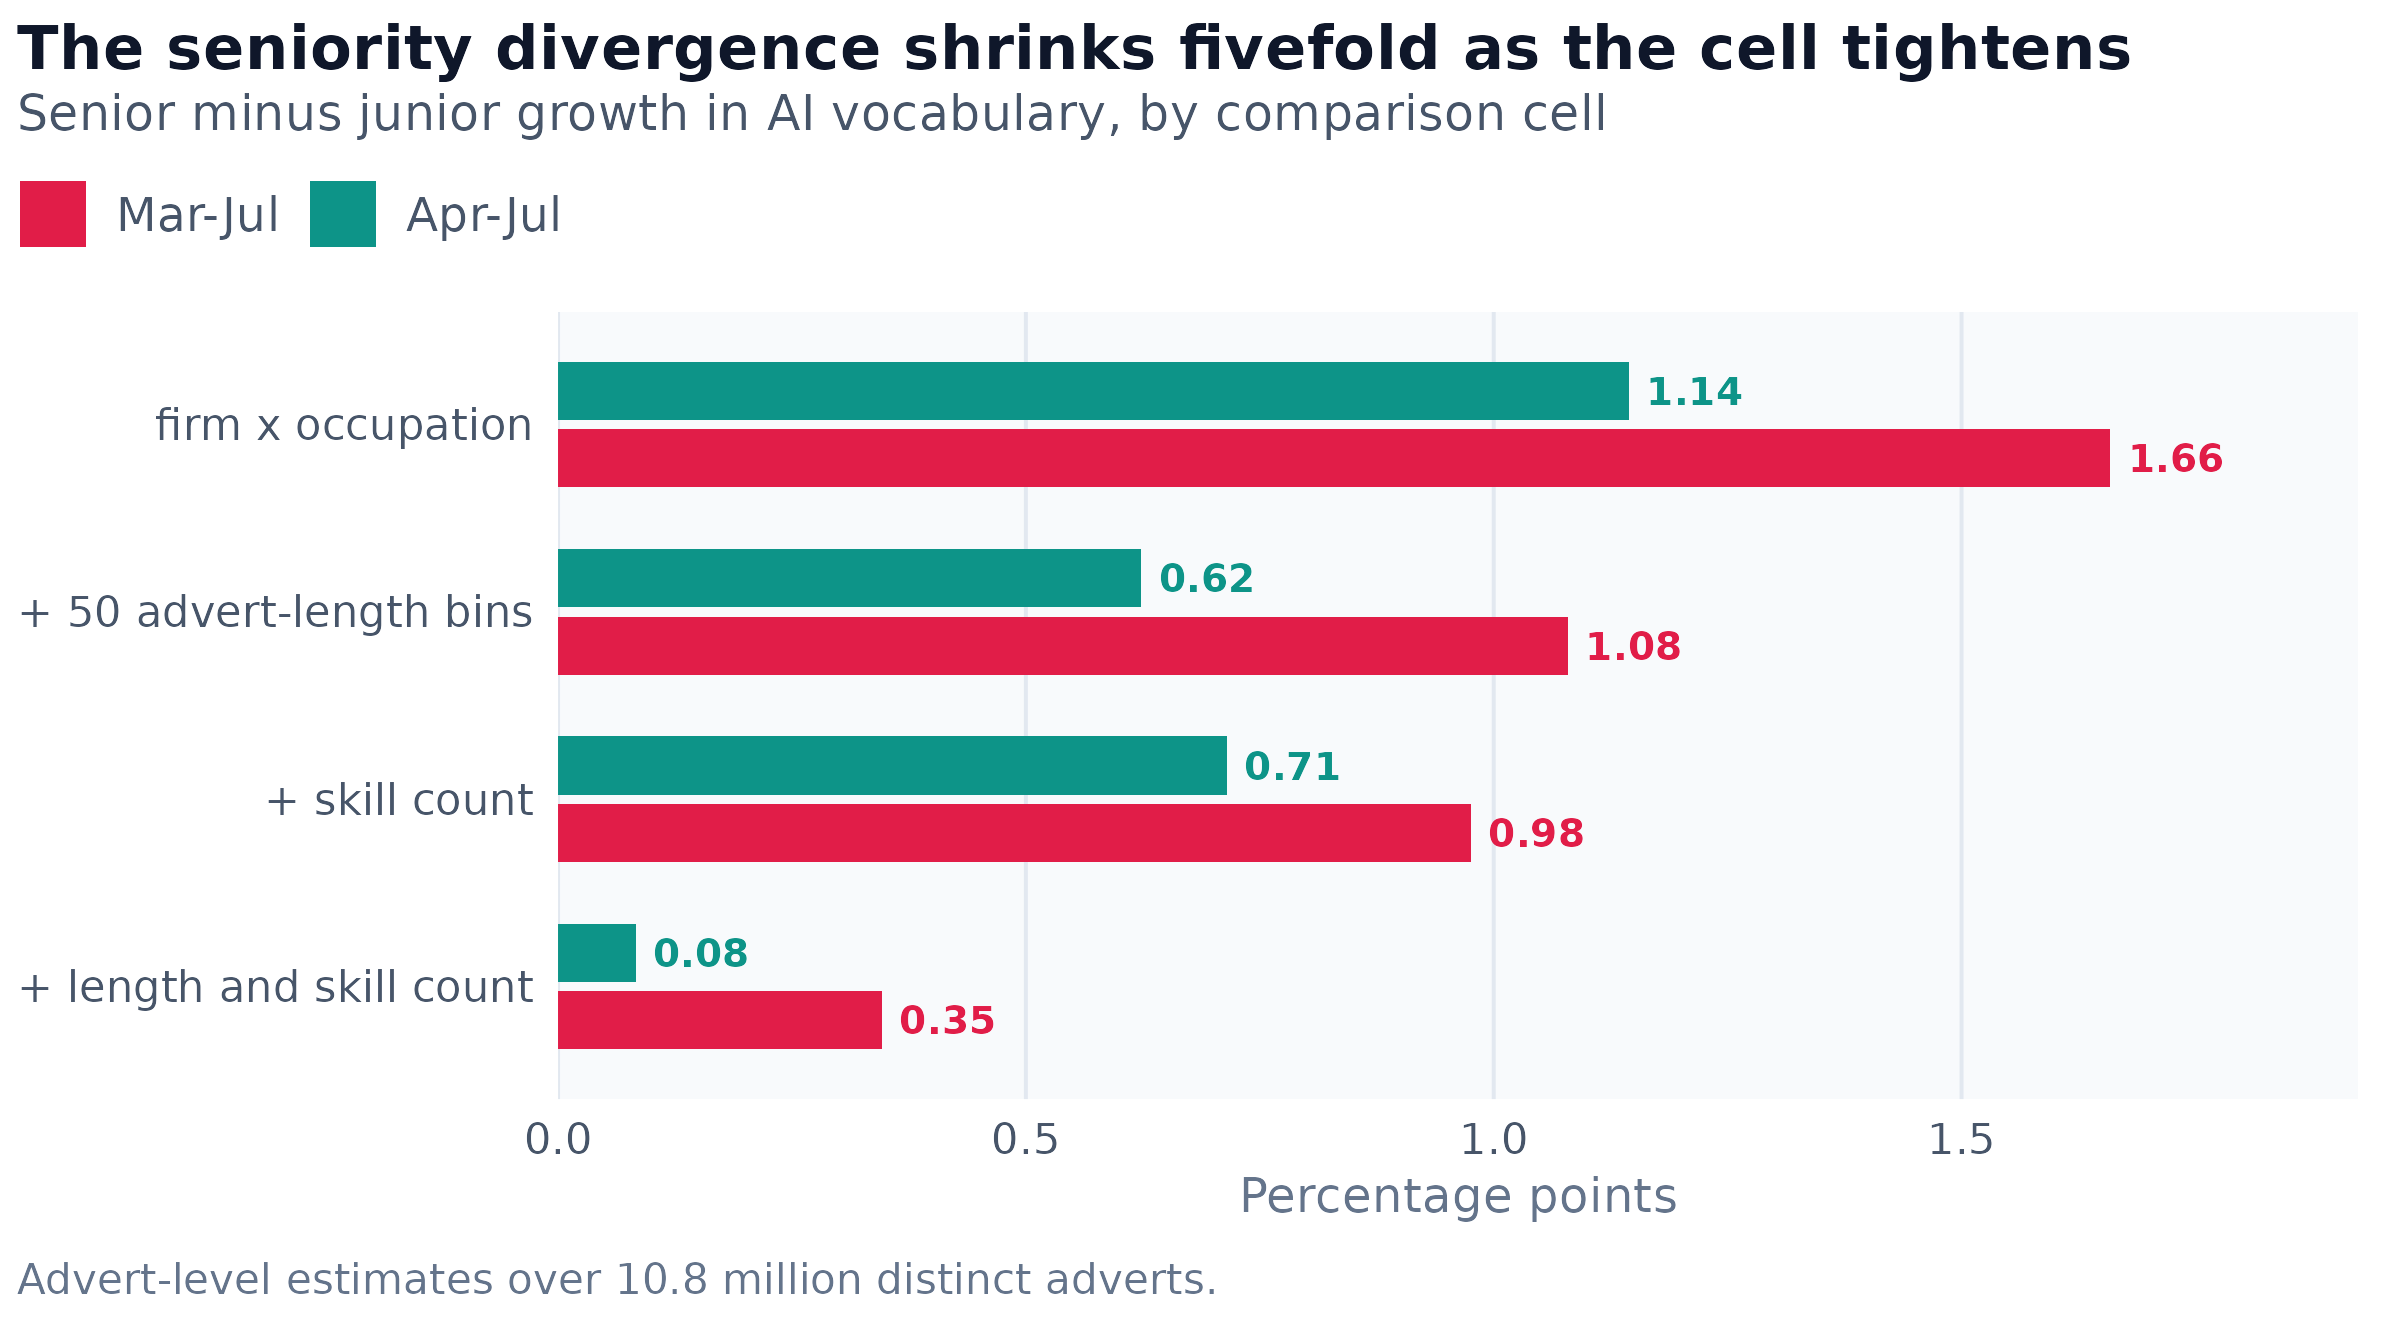
Figure 1: Each bar is the same quantity, the difference between senior and junior growth in generative-AI vocabulary, estimated inside progressively finer comparison cells. The Mar-Jul window spans a documented change in the crawler’s coverage at the March-April boundary; the Apr-Jul window does not. Values are percentage points.
The estimate falls sharply between the coarsest and the finest specification, and on the window that excludes the crawler’s coverage change it becomes indistinguishable from zero. Two readings are available. The control may be closing a genuine back door, in which case the small number is the honest one. Alternatively it may be blocking the causal path itself, since an advert that adopts new vocabulary thereby says more, in which case the fine control removes the effect rather than a confound.
I attempted to settle this by comparing a control measured on the advert with one measured on its comparison cell before the period began, on the reasoning that a pre-existing confound would appear in the earlier measurement and a mediator would not. That comparison does not do what I claimed. The cell-level measure is by construction constant within a cell, so it has exactly one value per cell for 100.0000 % of the 1.6 million cells involved, and a stratifier constant within a cell cannot separate anything inside it. The stratified estimate turned out to equal the pooled estimate with cells simply reweighted, agreeing to within two parts in a billion billion. The conclusion survived on different evidence, namely that the two arms differ by the same standardised amount on both versions of the measure, but the argument I had given for it was invalid. This is the least comfortable result in the audit and the most instructive: a diagnostic can be arithmetically inert and still read as decisive.
The comparison that decides whether a finding is about its subject
A second family of claims held that adverts mentioning artificial intelligence make distinctive demands. The test that matters is not whether the demand exists but whether it is peculiar to that vocabulary, and the way to find out is to run the identical estimator with other vocabularies in the treatment slot.
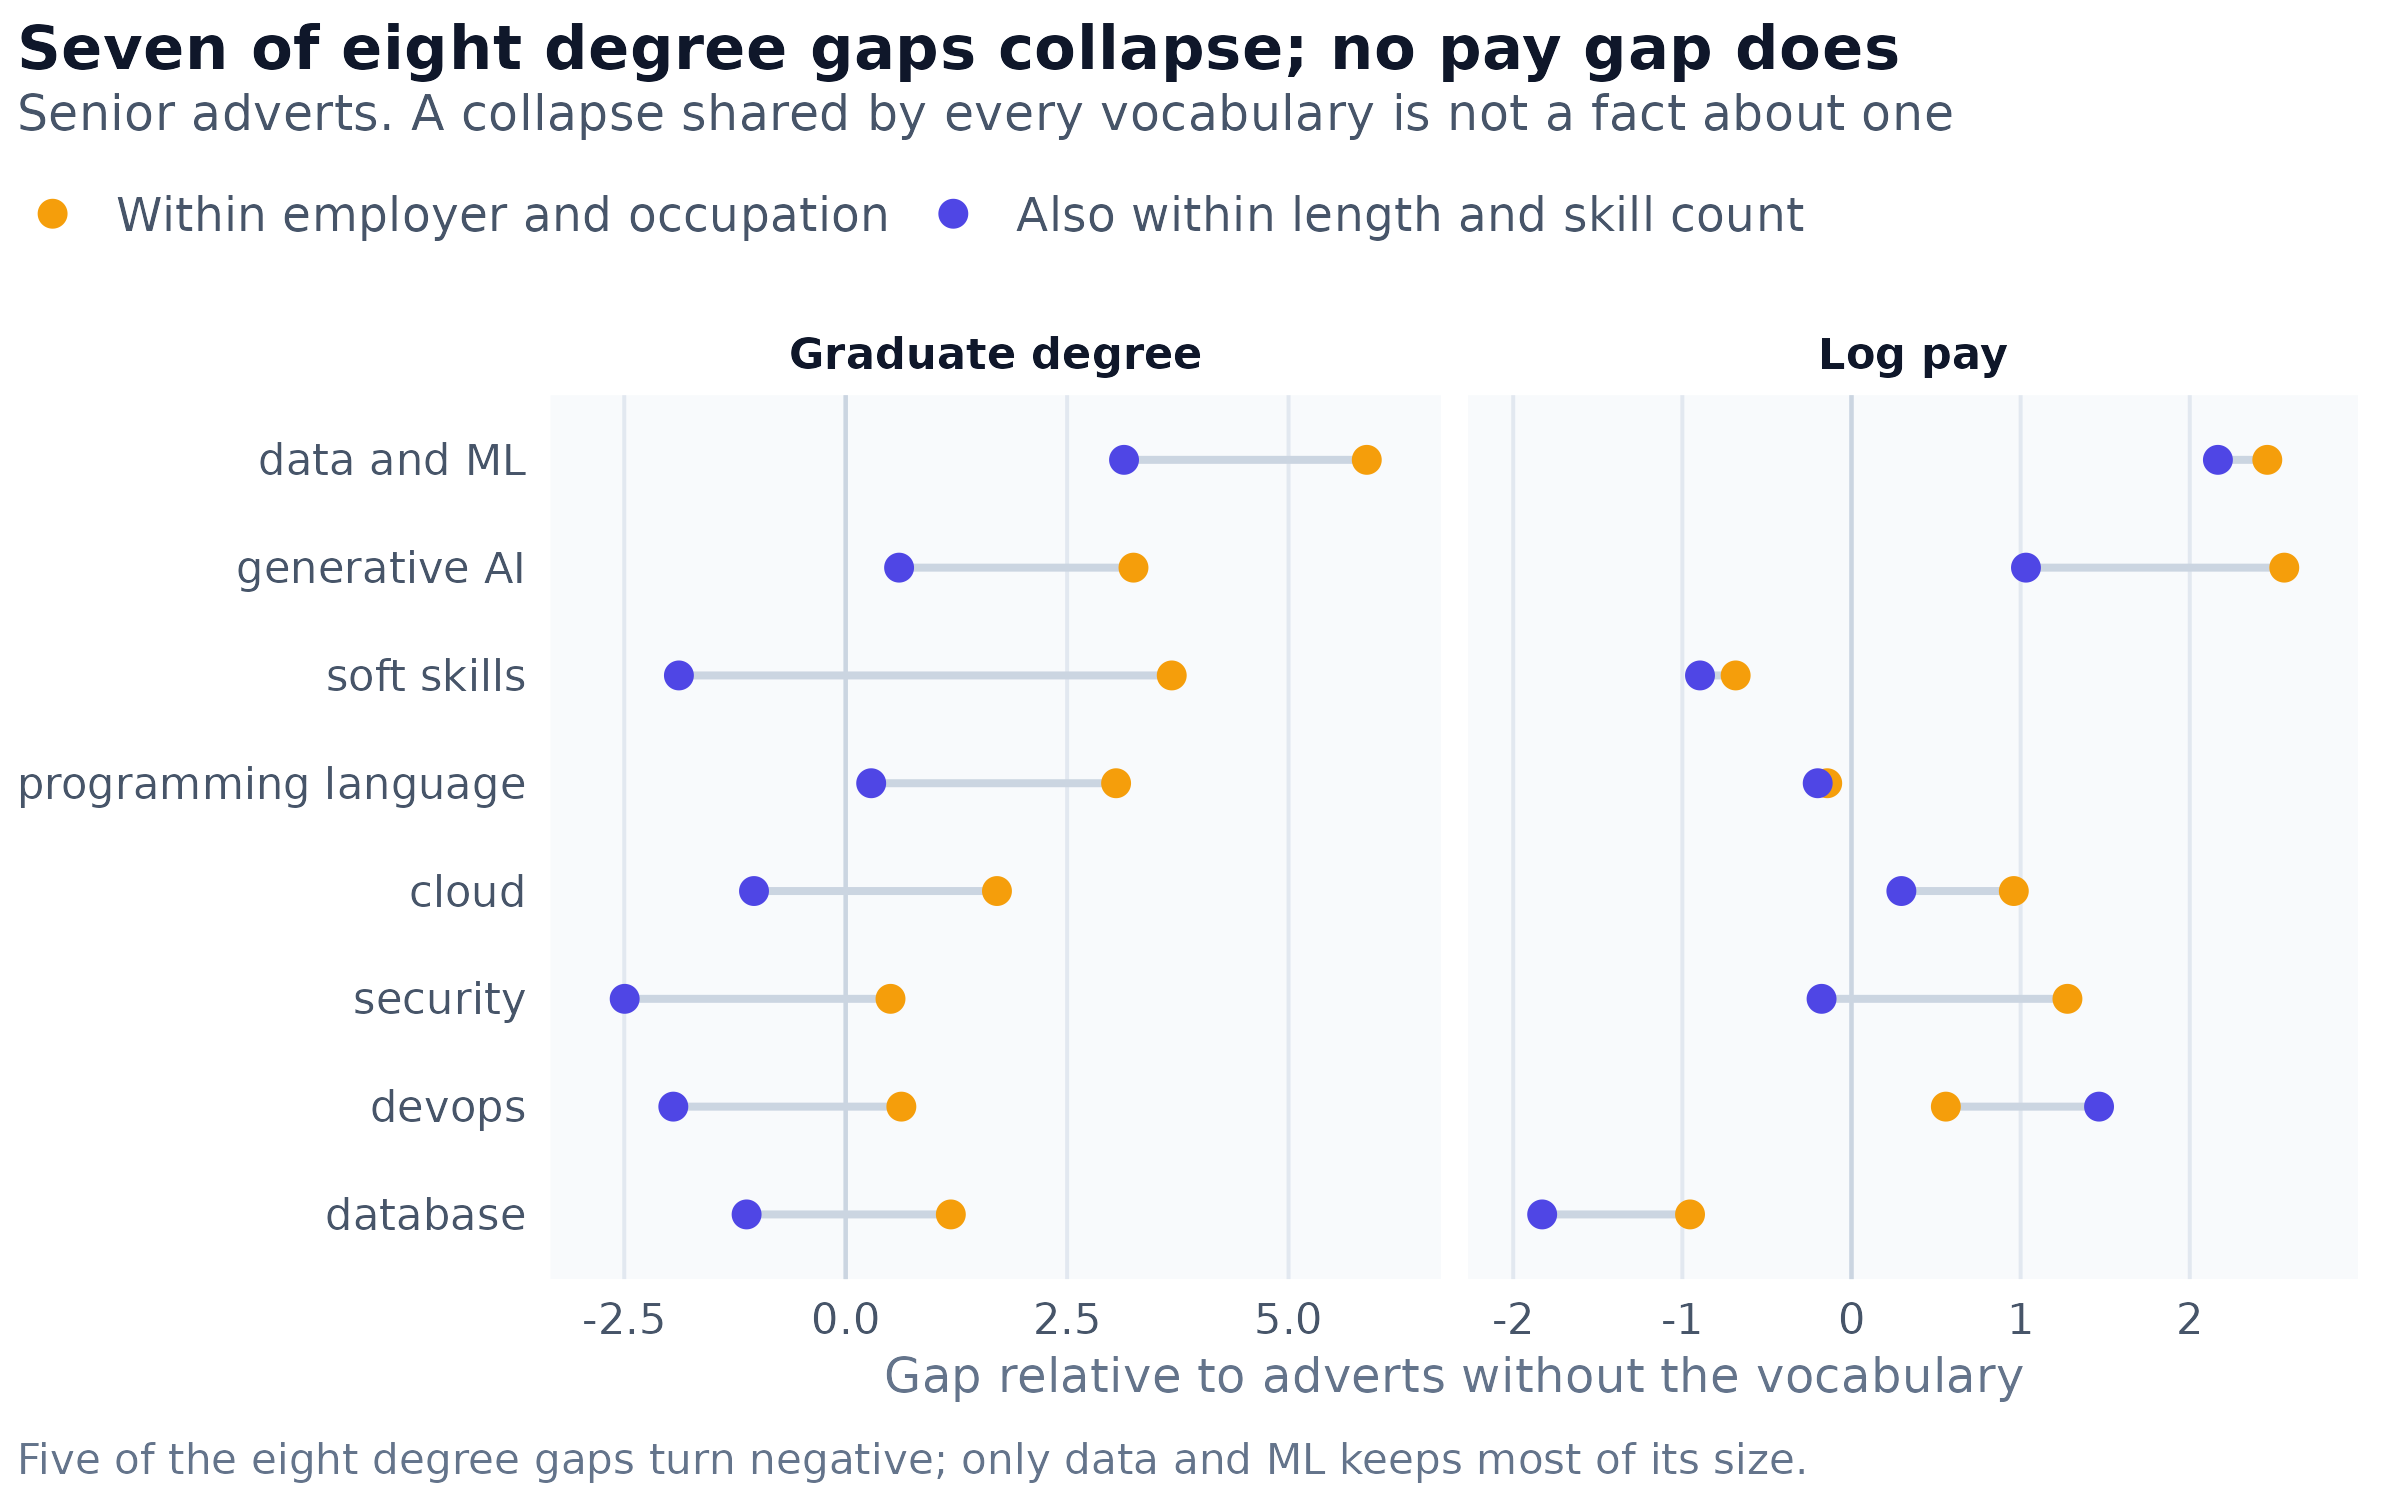
Figure 2: Eight skill vocabularies through the identical estimator. Each segment runs from the gap estimated within employer, occupation and month to the gap estimated in the same cell subdivided by advert length and skill count. Graduate-degree gaps are percentage points; pay gaps are log points, approximately percentages.
All but one of the graduate-degree gaps fall to zero or reverse under the same control. The pay gaps behave in the opposite way and are preserved almost uniformly. The claim that an AI advert demands more graduate degrees was therefore correct as arithmetic and wrong as attribution: the demand is real, it is not separable from the number of skills the advert lists, and no vocabulary’s version of it is separable either. A control that removes an effect for every treatment tested is telling one something about the outcome rather than about the treatment.
Four routes to one number
The corpus contains one clean policy event, the 7 June 2026 compliance deadline of the European Union’s Pay Transparency Directive, and the natural estimate compares member states against everywhere else. That estimate is roughly two and a half times too large, for a reason invisible in the difference itself.
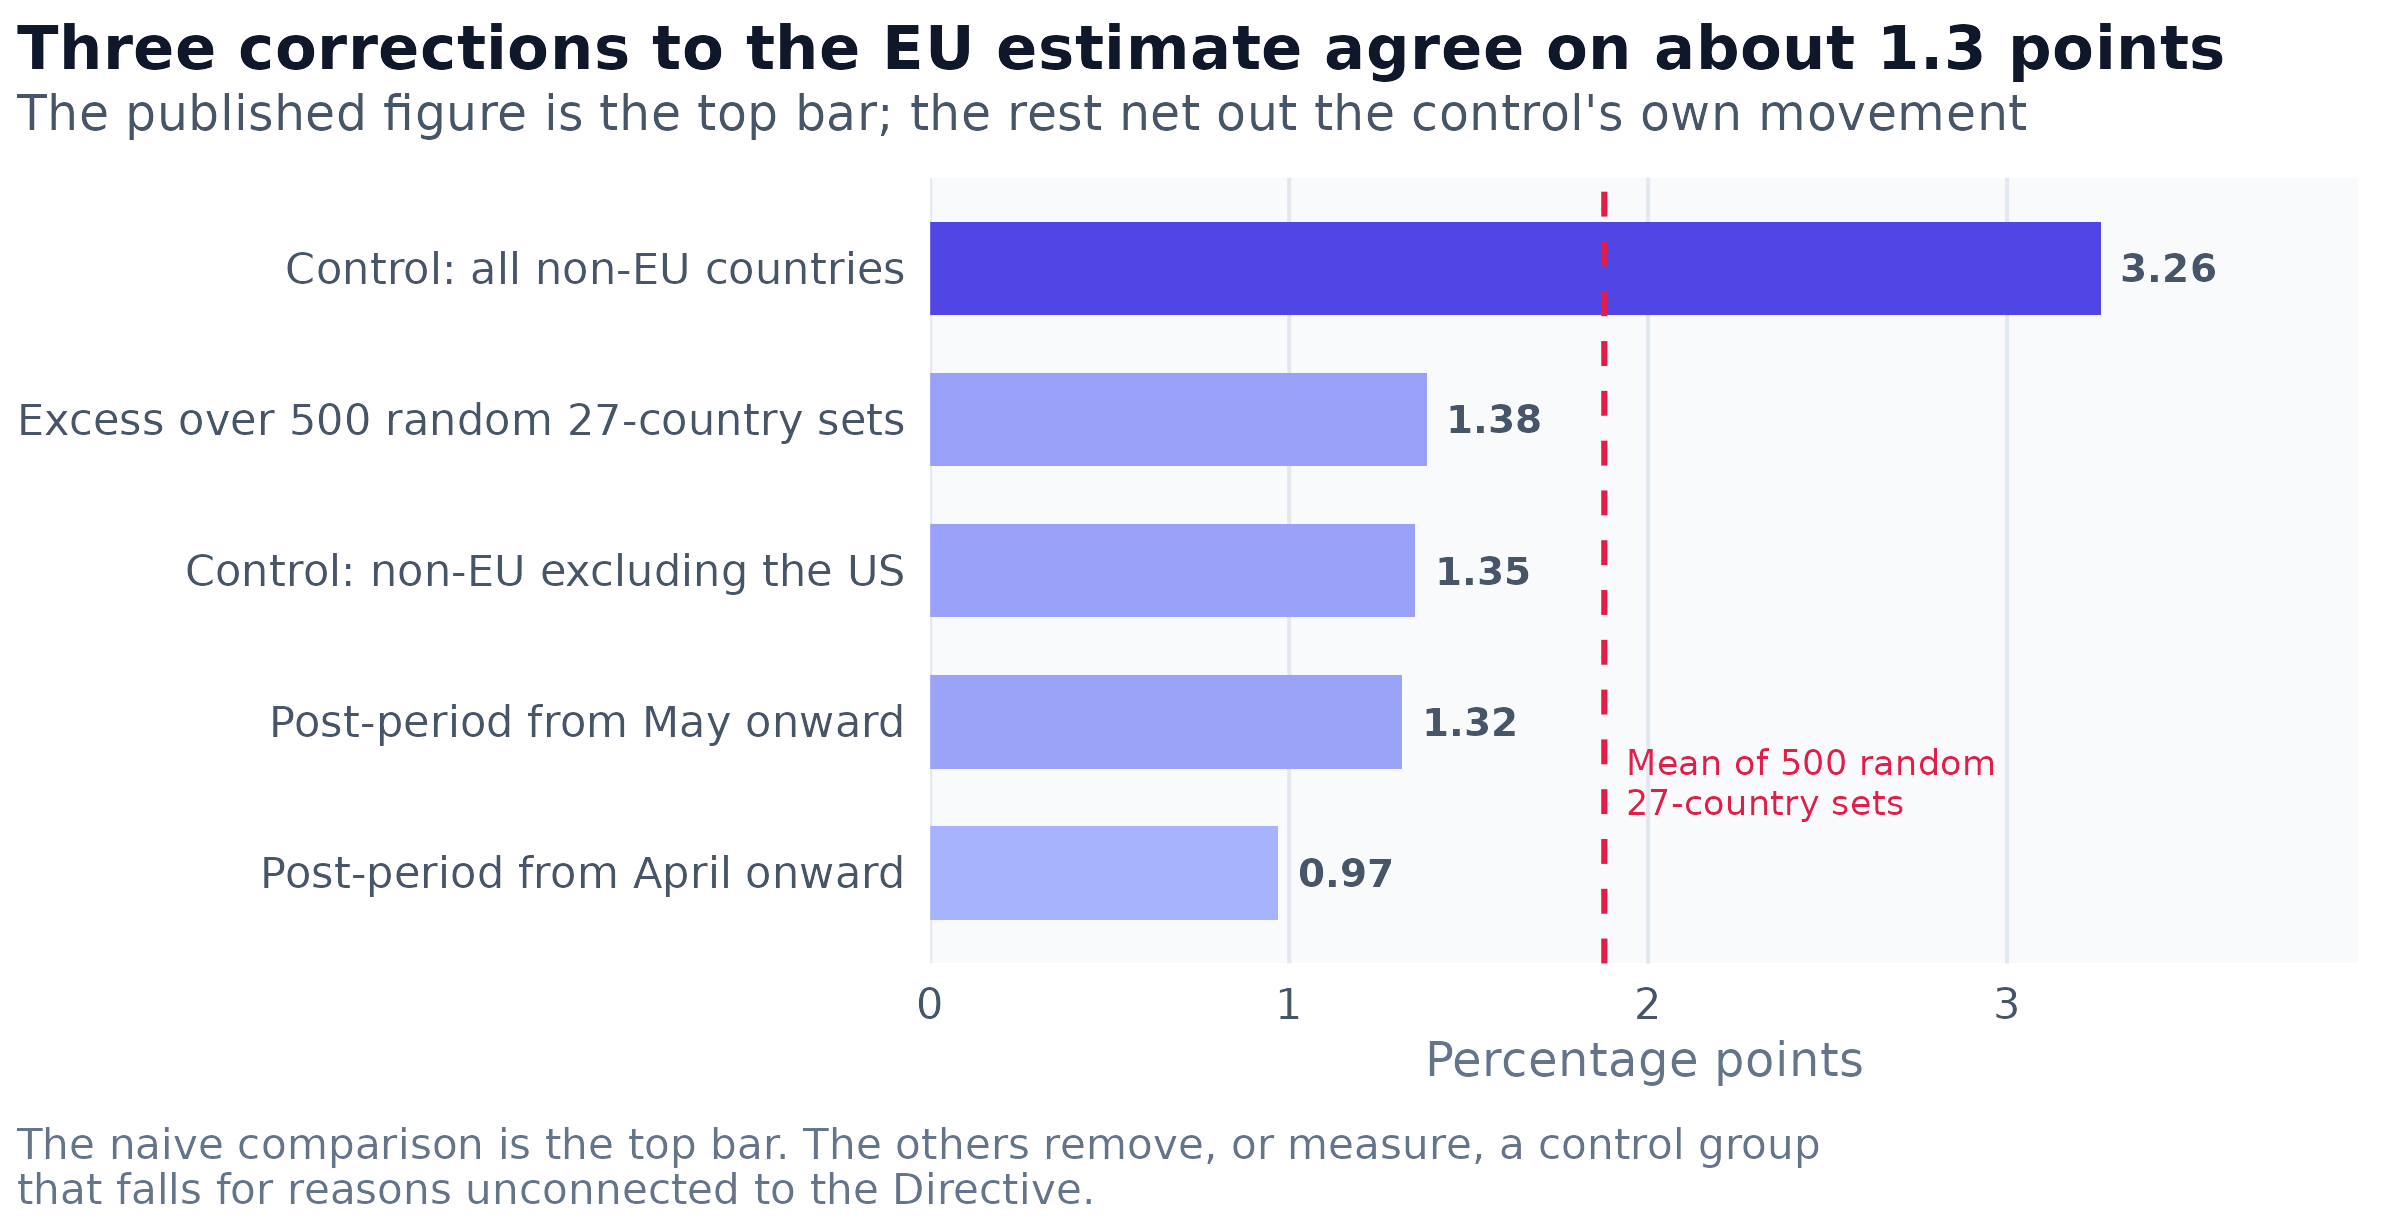
Figure 3: Five estimates of the same event on junior distinct adverts, within employer and occupation. The dashed line marks the mean estimate produced by 500 randomly drawn, size-matched sets of 27 non-EU countries, which is what the estimator returns when there is no treatment at all. Values are percentage points of pay disclosure.
The control group falls over the window, and it falls for a reason unconnected to the Directive: LinkedIn stopped populating one of its three pay fields after March, and that field’s weight is concentrated in the United States. Removing the United States from the control group, subtracting what a randomly chosen comparison group of similar size produces, and moving the post-period boundary earlier than the field’s disappearance are three procedures that share no assumptions, and they land within 0.07 of a point of one another. The event is real. It is well under half the size I published.
The lesson is narrower than it first appears and worth stating precisely: a difference-in-differences reports the treated arm minus the control arm, so a control arm that moves for its own reasons enters the estimate at full weight and leaves no trace in the headline number. Printing the control group’s own trend beside the difference would have caught this immediately, and for several phases nobody printed it.
What a permutation test can and cannot settle
The seniority divergence had passed every robustness check applied to it and still rested on an analytic standard error. Because the estimator averages differences across cells, that standard error assumes those cells behave like independent draws, which is an assumption rather than a measurement. The alternative is to reassign the labels at random and observe what the estimator returns when there is nothing to find.
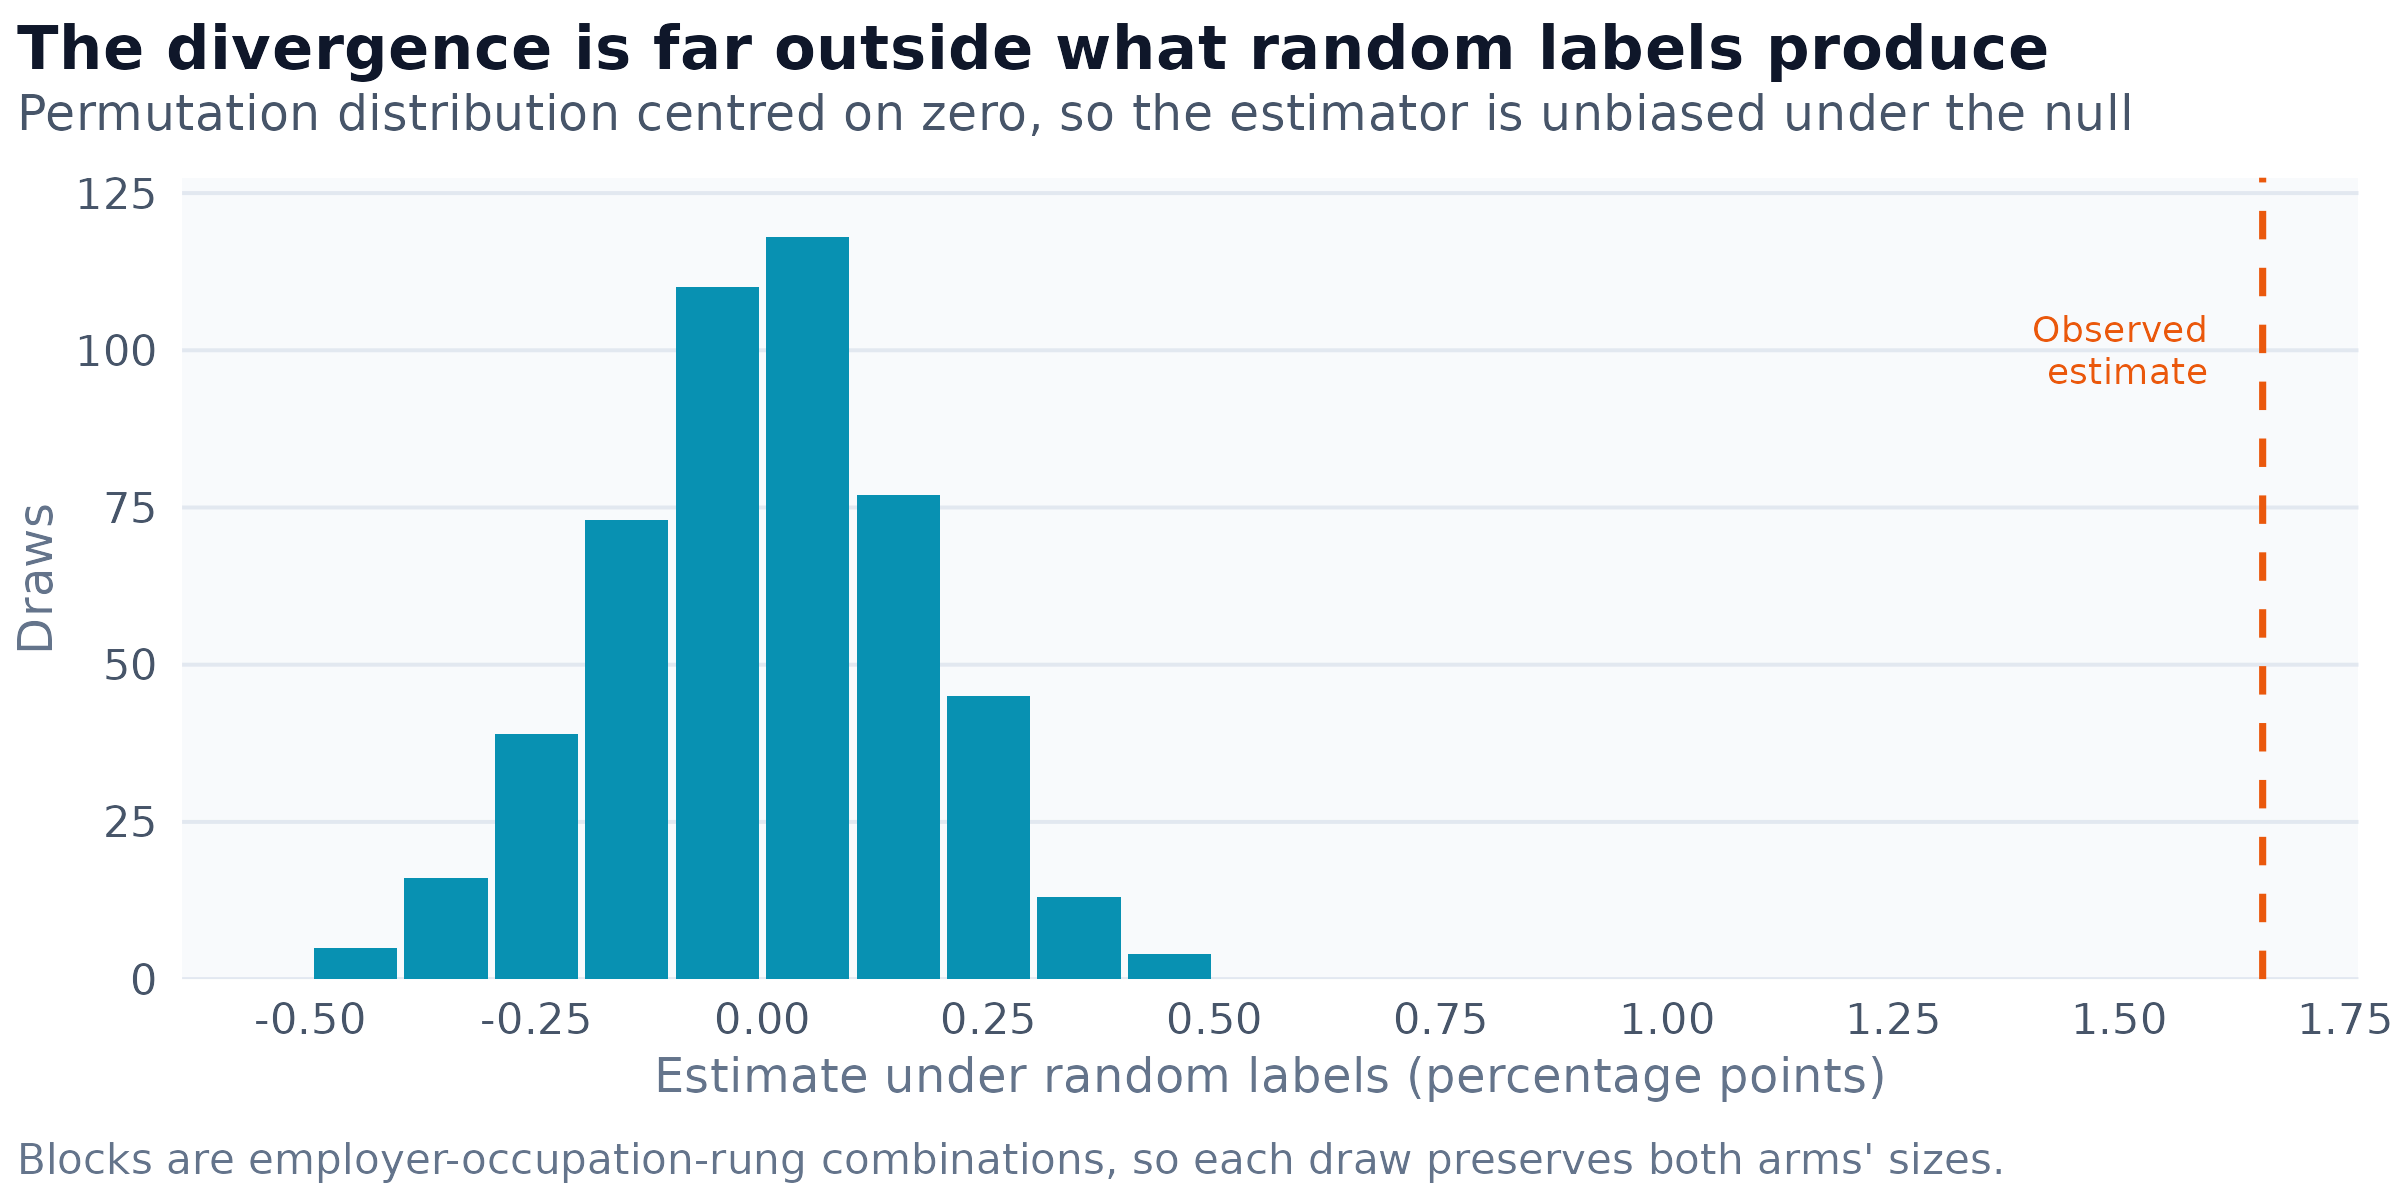
Figure 4: Distribution of the estimator under 500 random reassignments of the junior and senior labels across 1,433,634 employer-occupation-rung blocks, Mar-Jul. The dashed line is the observed estimate. No draw reaches it, so the randomization p-value is below one in 500.
The permutation distribution is centred on zero and the observed value sits more than five times beyond its 95th percentile. The finding is not an artefact of the estimator.
Choosing the unit to permute is where this test can be got wrong, and I got it wrong first. Permuting the seniority label within an employer-occupation cell left the null distribution centred on the observed estimate rather than on zero, because only 0.3081 % of cells contain both a junior and a senior advert. That permutation changed almost nothing and its p-value of 0.39 measured nothing. A permutation distribution centred on the quantity it is meant to test has not randomised anything, and reporting its mean is the cheapest way to notice.
The same machinery raises an uncomfortable question about every null result in the programme.
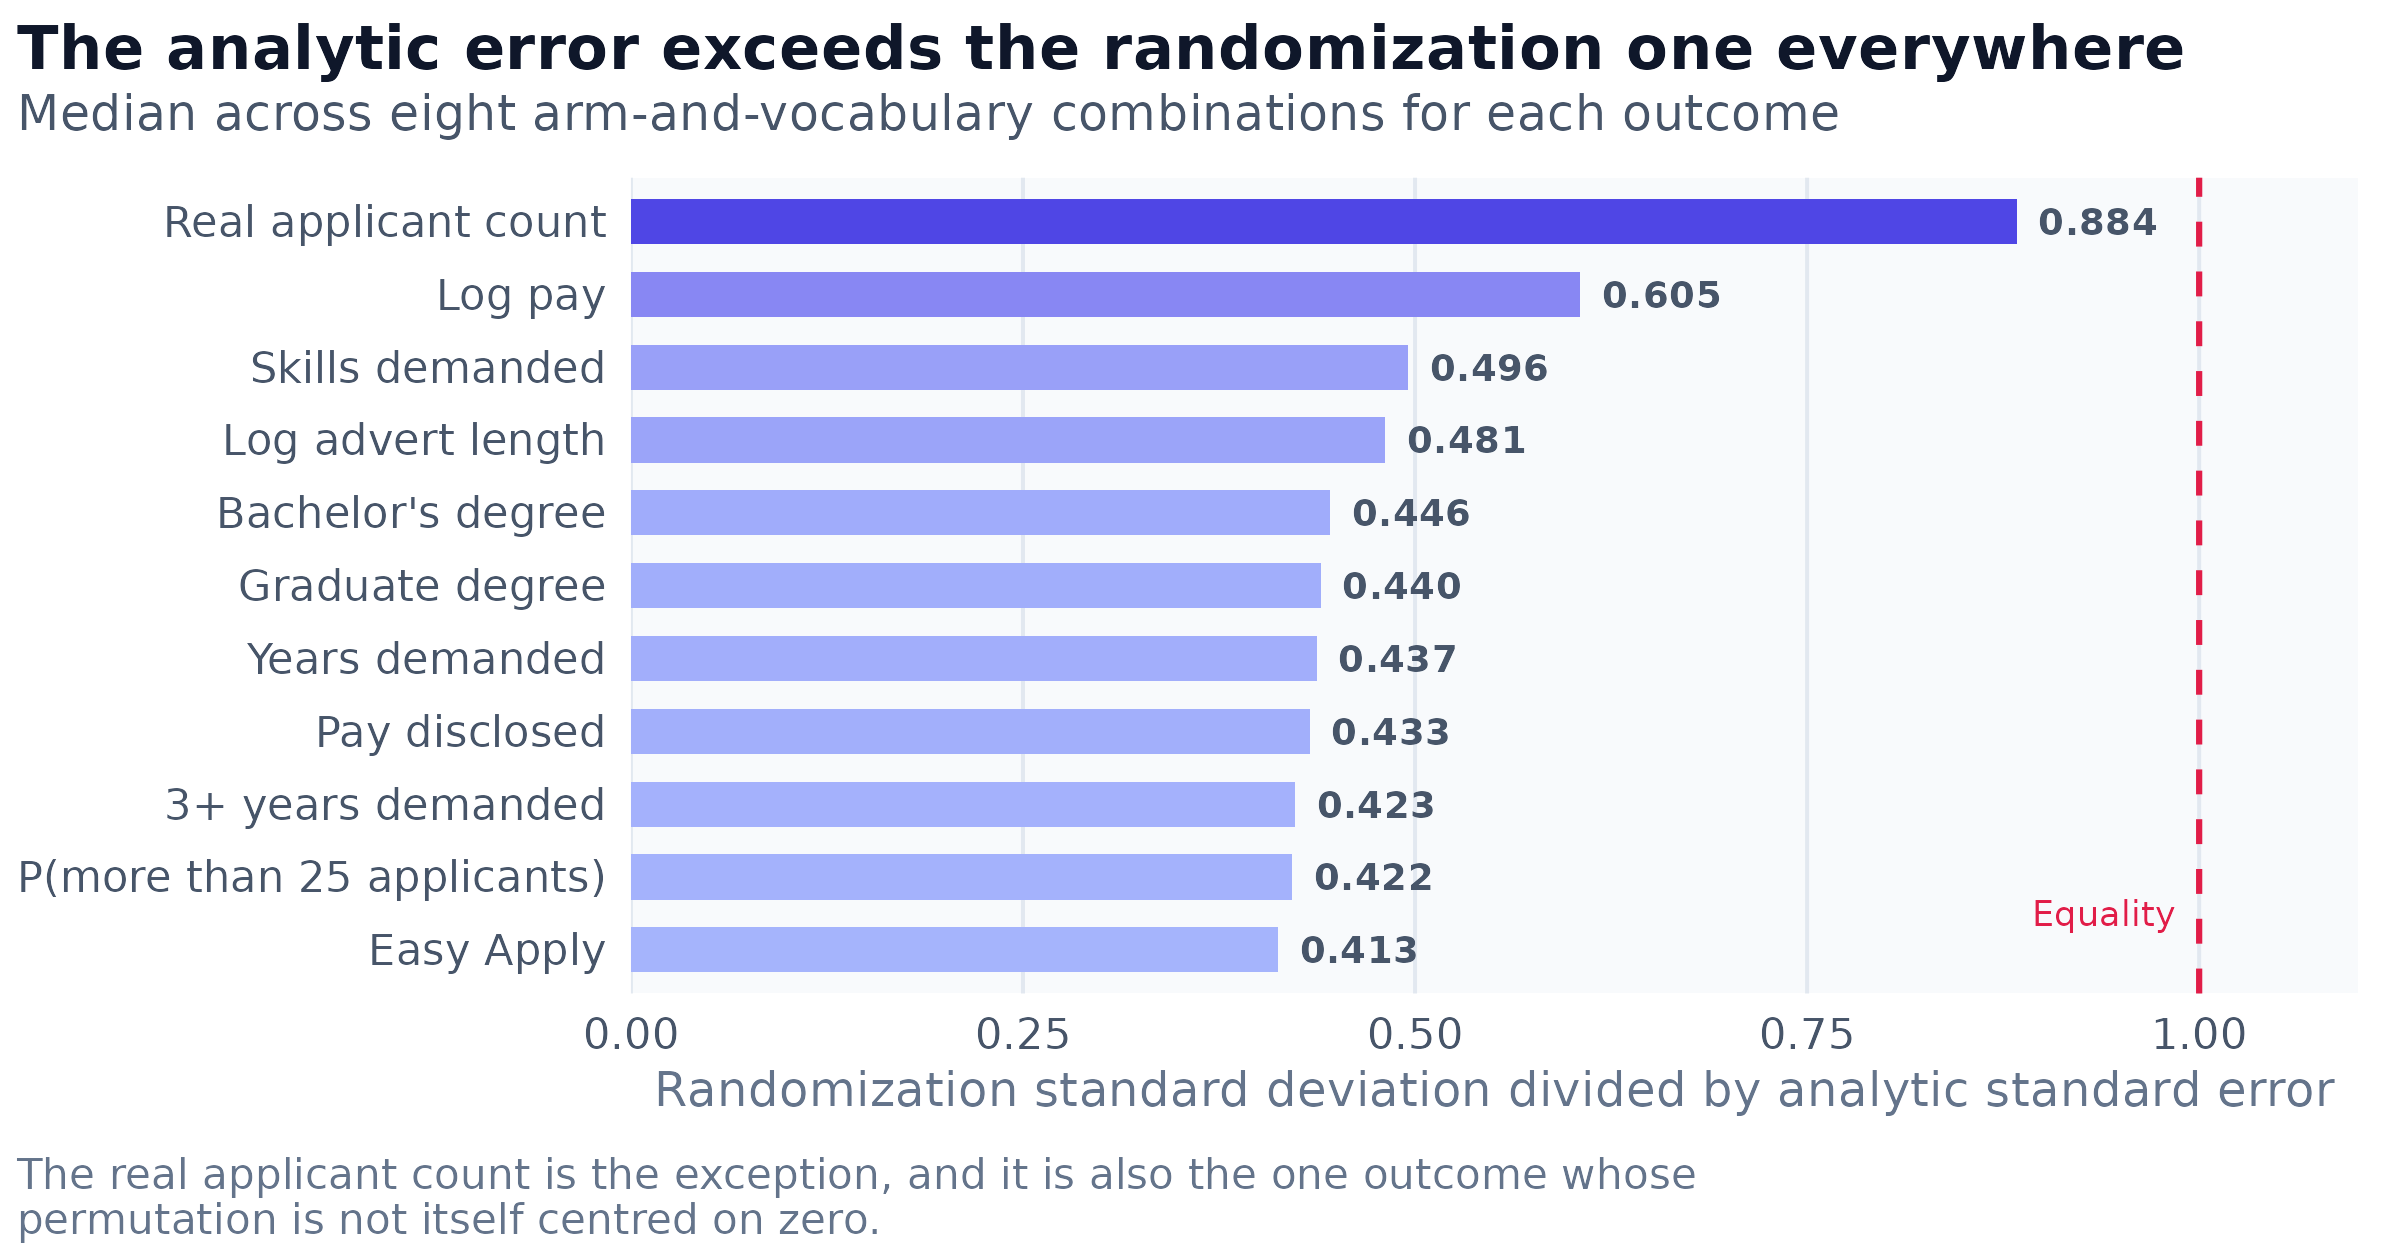
Figure 5: Ratio of the randomization standard deviation to the analytic standard error, median across eight employer-arm and vocabulary combinations for each outcome. Every combination tested falls below the dashed line of equality.
Every combination tested has a randomization spread narrower than its analytic standard error, and twenty of the eighty-eight estimates that the analytic calculation calls null reject under the permutation test, while none moves the other way. The correct inference is limited, and stating it carefully matters. The two quantities answer different questions: the permutation spread describes the estimator under the sharp hypothesis that the treatment was assigned at random inside each cell, whereas the analytic error targets sampling variation in a wider population and legitimately includes components the sharp hypothesis holds fixed. It does not follow that the published standard errors should be rescaled. What does follow is that every null result in this programme is weaker evidence of absence than its minimum detectable effect implies, and each needs re-testing before it is treated as settled.
The one result that keeps arriving by new routes
Amid the withdrawals, a single pattern has now been reached six independent ways: the identity of the employer explains far more of this corpus than the identity of the job. Earlier phases established it for text measures using lift instruments, shift-share decompositions and split-half reliability. The strongest version uses no text at all.
Within postings observed twice while still open to applications, the applicant counter is a running total, which yields the only genuine flow the corpus supports: an arrival rate in applicants per day. It exists for 2.77 % of appearances, because both observations must be open and both must carry a real count rather than the platform’s placeholder, so it describes adverts already drawing a countable flow rather than vacancies in general.
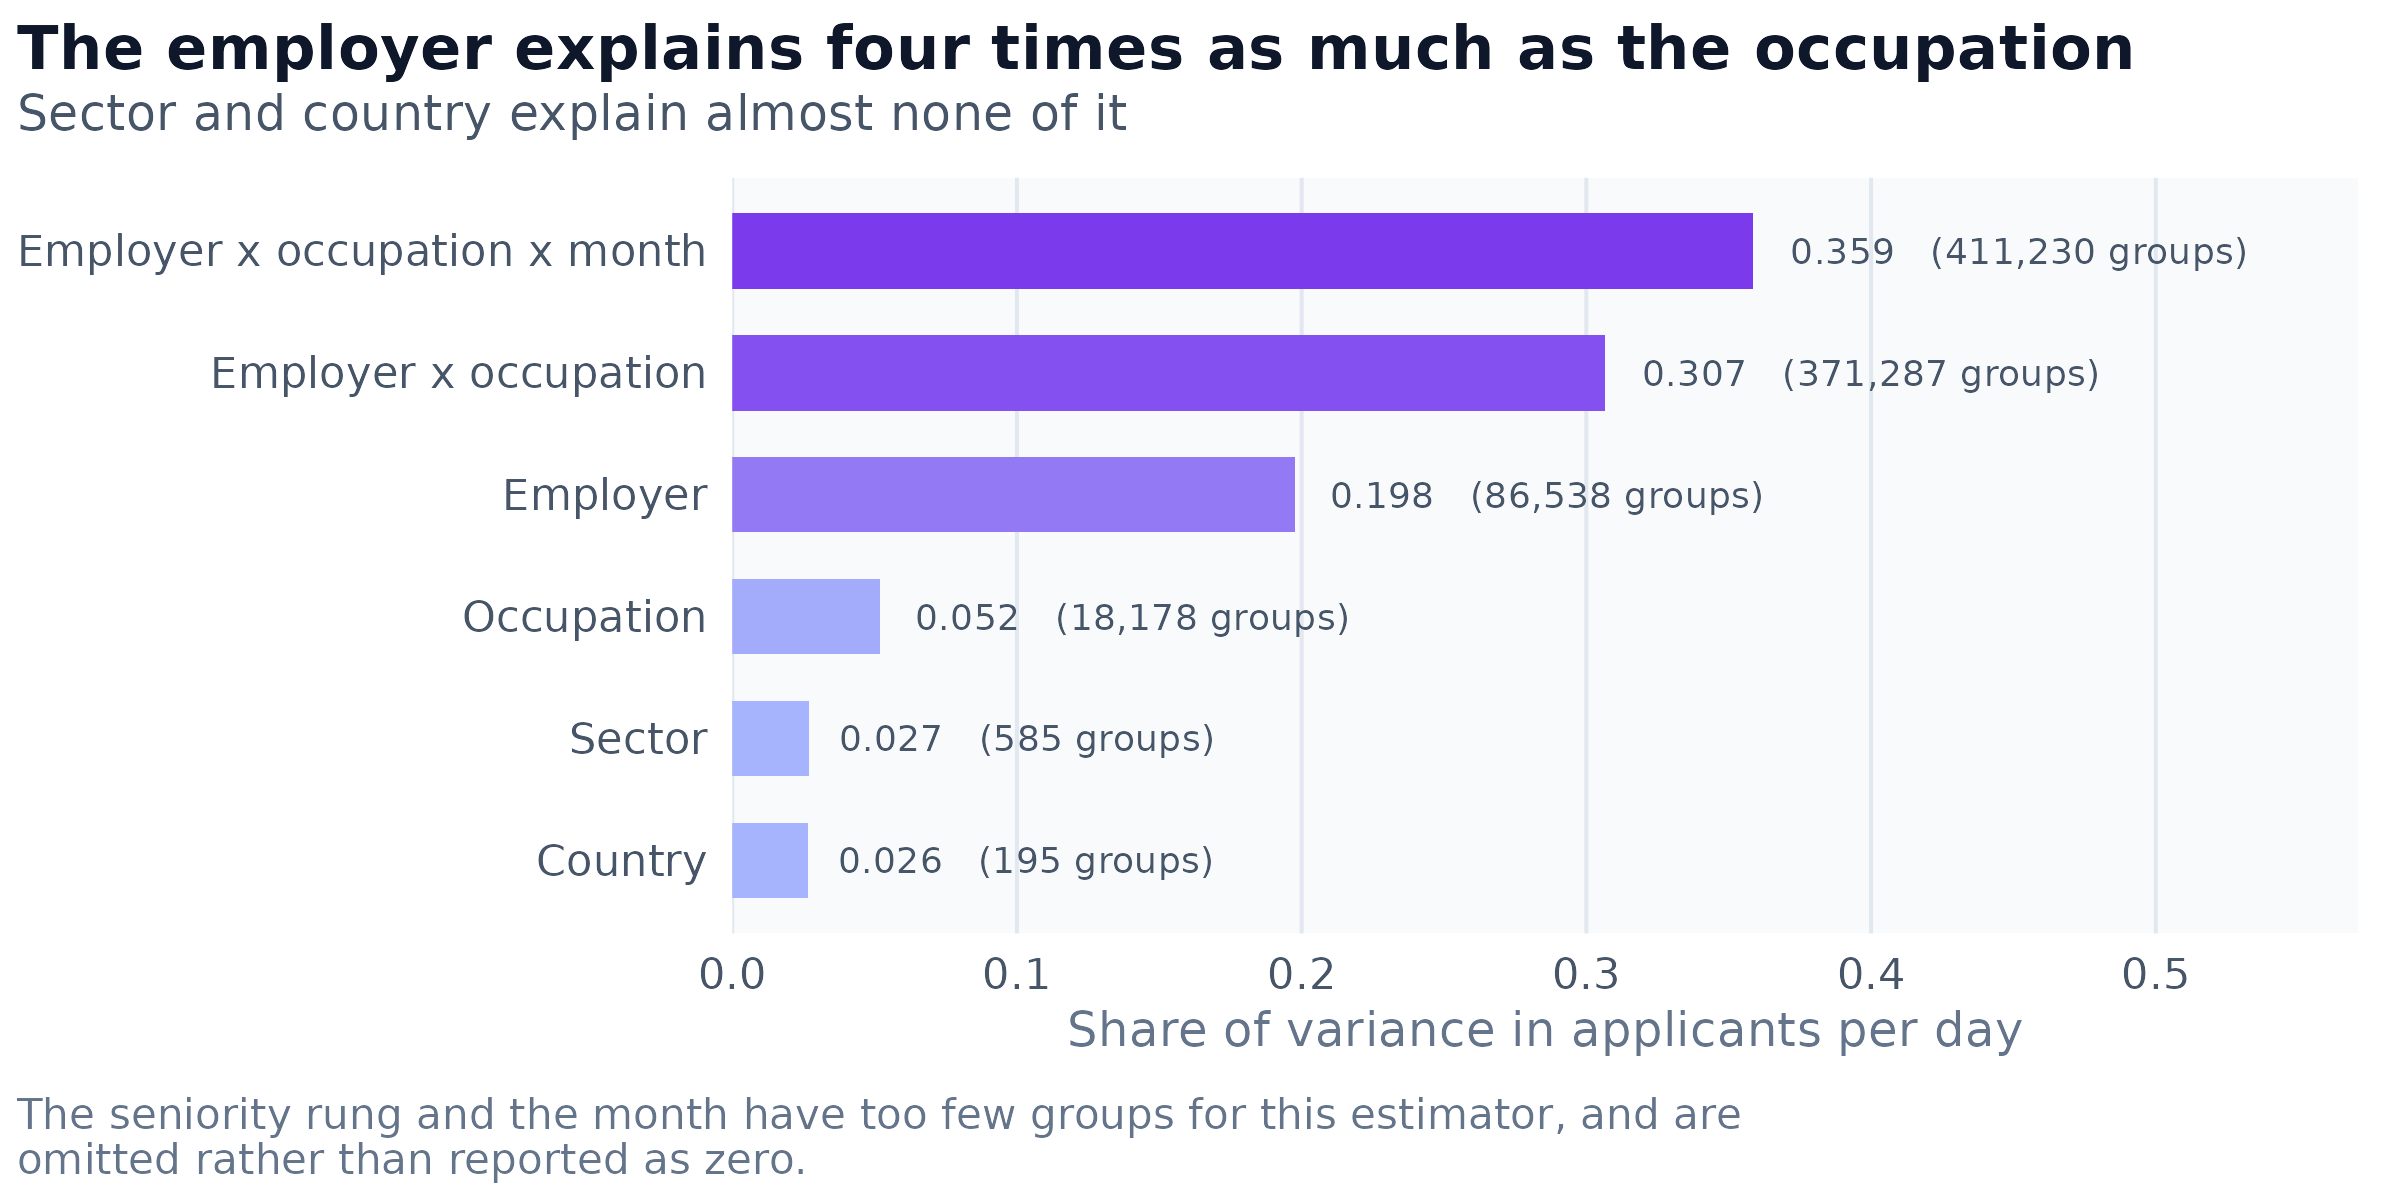
Figure 6: Between-group share of the variance in the applicant arrival rate, from an unbiased split-half estimator that does not reward a grouping for having more groups. Group counts are given beside each bar.
Sector and country are nearly irrelevant, and the interaction of employer and occupation exceeds the sum of the two separately, so an employer’s advantage is partly specific to the roles it advertises. Since this outcome is a behaviour rather than a form of words, it cannot be an artefact of how adverts are written, which is the objection that applies to every text-based version of the same result.
Asking which features of an advert predict that flow gives an answer that is almost entirely about the mechanics of applying.
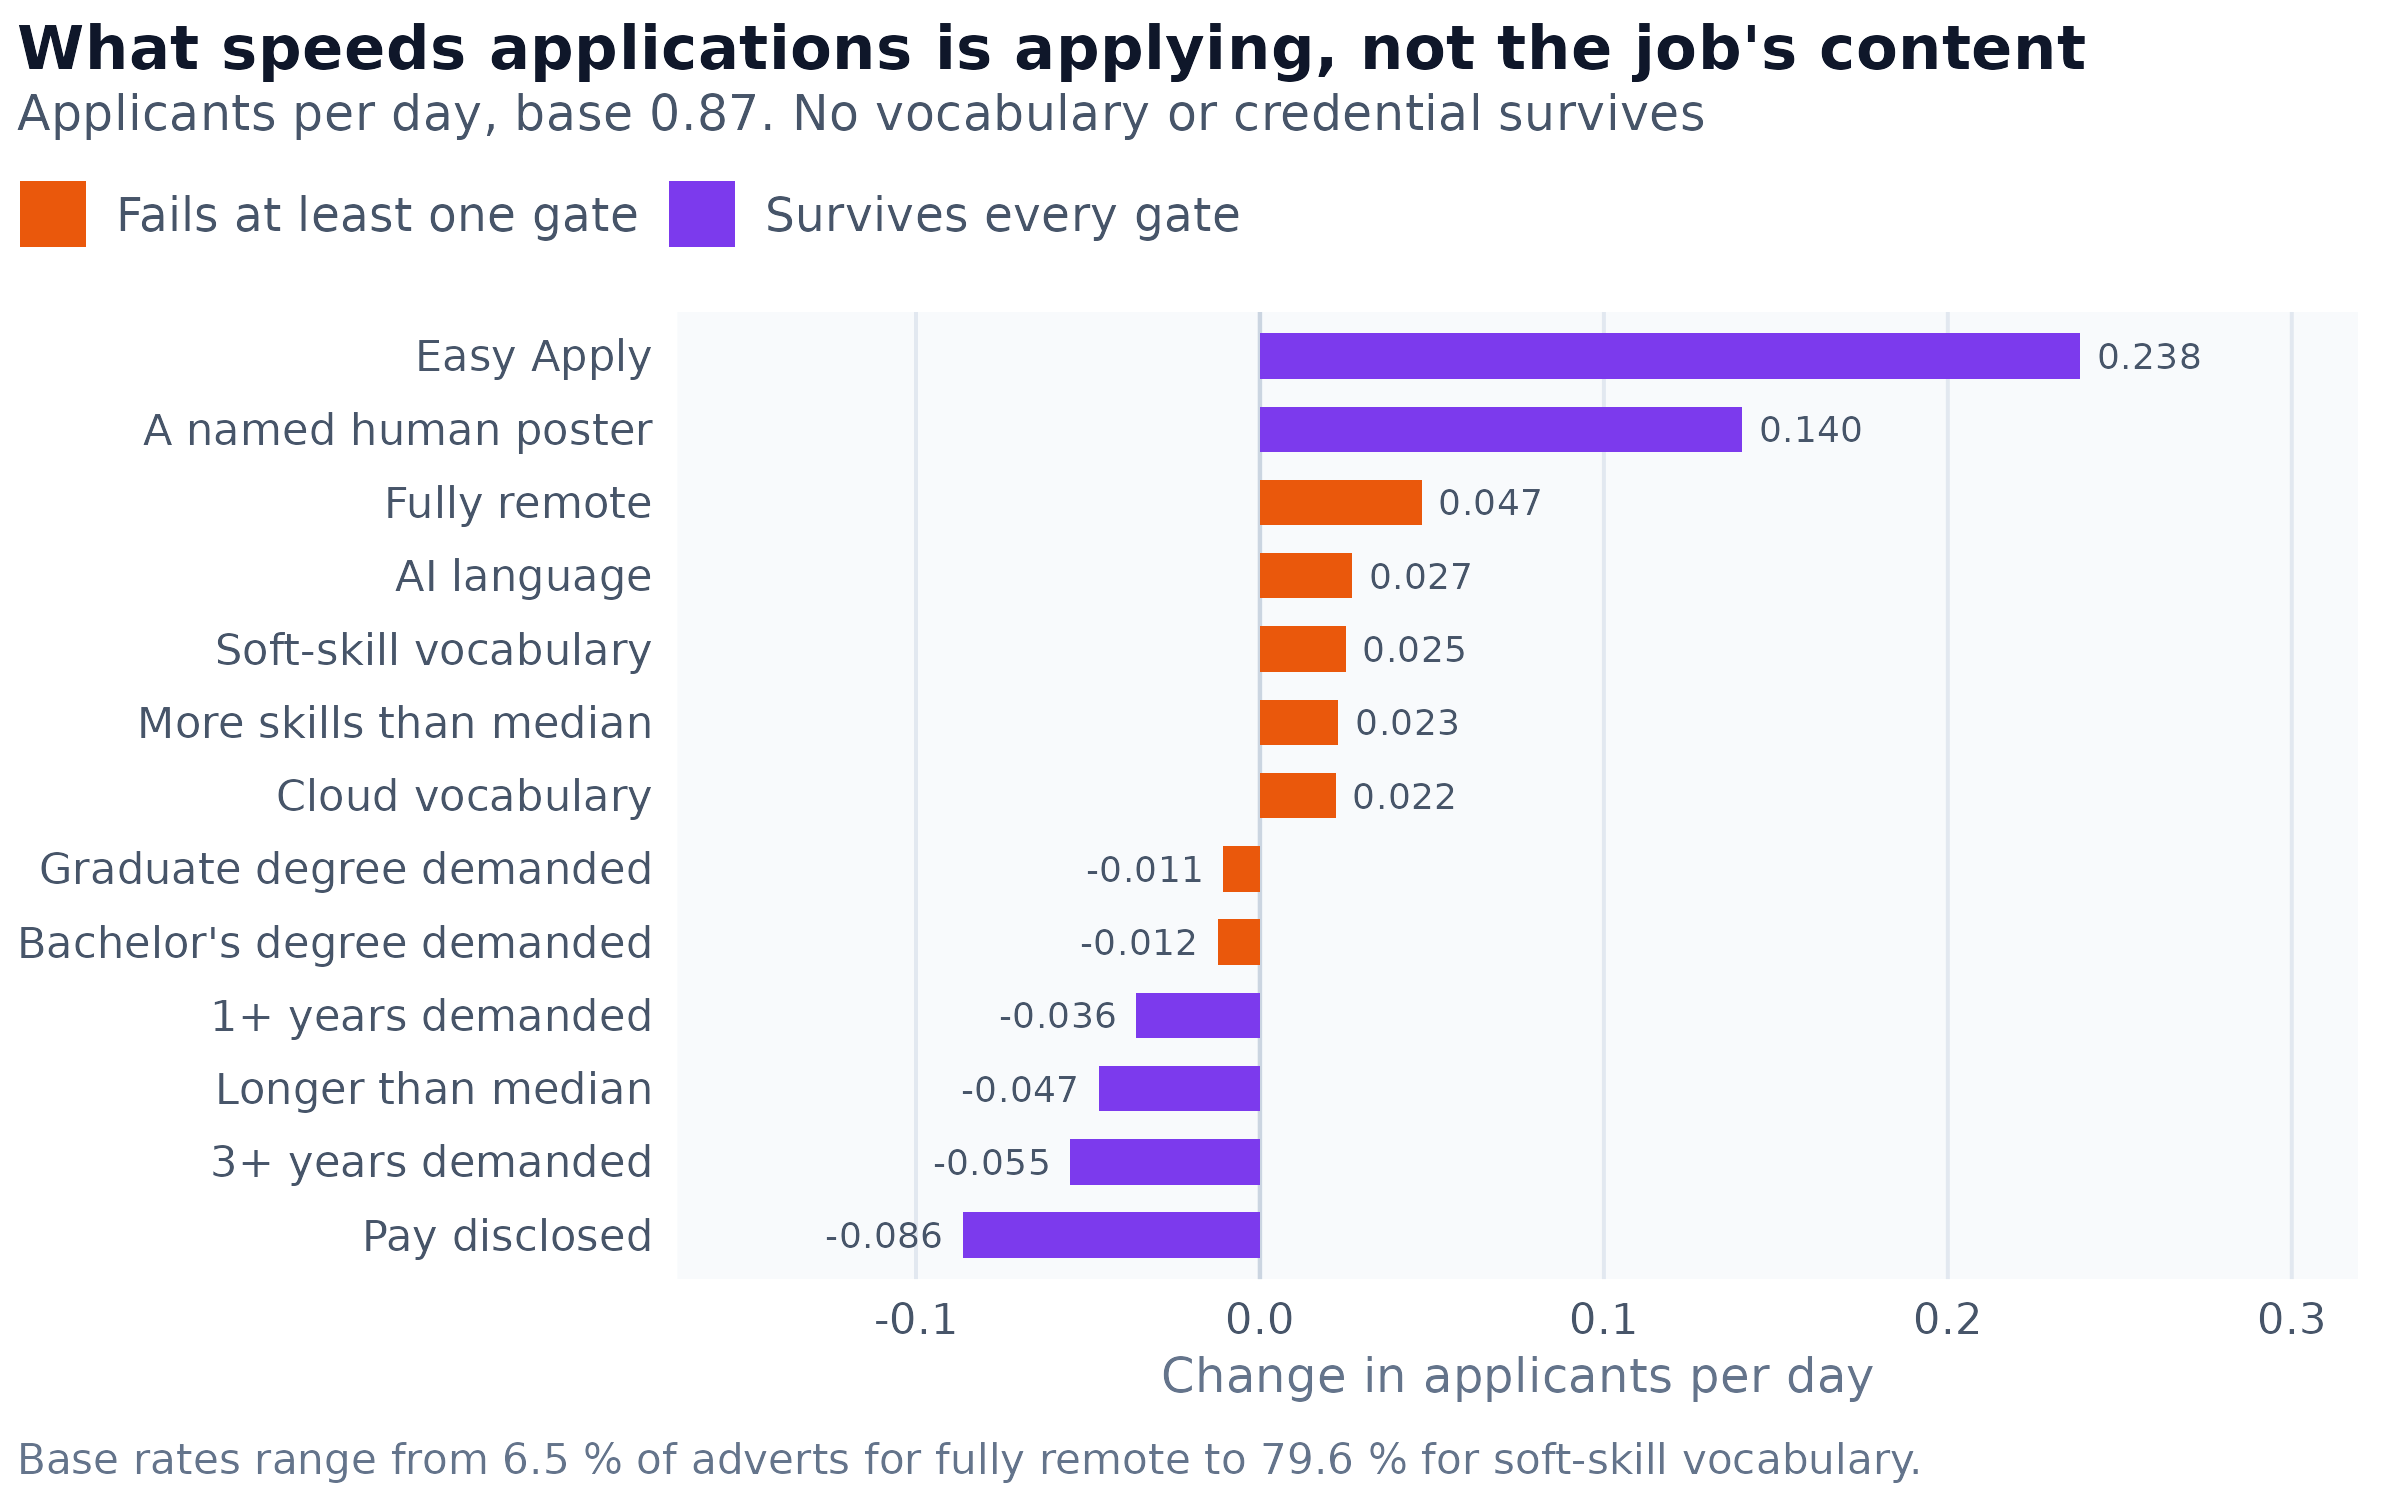
Figure 7: Thirteen advert features and the applicant arrival rate, within employer, occupation and month, February excluded. A feature is marked as surviving only if it clears an exact leave-one-employer-out, a leave-one-country-out over the ten largest countries, a placebo treatment drawn at the feature’s own base rate, and a t-statistic above two.
The two features that raise the arrival rate are a one-click application button and the presence of a named human recruiter. Everything the advert says about the work itself fails, and it fails in the manner a genuine null should: the four vocabulary and credential features lose significance on all ten country removals, and the two credential features additionally change sign on one. What lowers the rate is friction and demand, with the experience requirement showing a monotone dose response and the tightest identification in the table.
What the audit cost
None of this required unusual resources, which is worth saying because the natural objection to a falsification programme is that it is expensive. The seven stages reported here ran as 23 batch jobs consuming 13.6 CPU hours in total. The whole programme on this corpus, of which those stages are the last part, has run 5,134 jobs and 1,404 CPU hours, and 514 of those jobs failed or were cancelled, most of them because a diagnostic was wrong rather than because a computation was.
The permutation tests are affordable for a specific reason. Aggregating the data once to the level at which the estimator compares things, and then permuting that aggregate rather than the underlying records, reduces each additional draw to a pair of counting operations. Five hundred re-estimates then cost about what five would cost computed directly, which is what makes a randomization p-value practical on a corpus of this size at all.
What the audit leaves standing
The corpus supports a short list. Vocabulary about artificial intelligence is moving up the seniority ladder faster than down it, though between 82 % and 90 % of that movement is which occupations sit in which arm rather than change inside an occupation. An advert mentioning it asks for more skills and pays slightly more, the latter no more distinctively than several other technical vocabularies do. Pay disclosure in the European Union rose after the Directive’s deadline, by well under half the amount the naive comparison implies. Who is hiring matters considerably more than what the job is. Applications arrive faster when applying is easier and slower when more is demanded.
It does not support most of the sharper stories, including several I published myself: that AI exposure narrows the entry-level door, that it raises credential requirements, that it restructures the advert, that AI adverts are withdrawn sooner, or that AI entry-level work is more often remote. Each is a property of technical, professional, or simply verbose adverts in general, or of a single large advertiser, or of one crawl boundary.
Three procedures did most of the work and would transfer to any observational corpus large enough to make significance cheap. Run the identical estimator with other treatments in the same slot, because a result shared by every treatment is a fact about the outcome. Print the control group’s own trajectory next to any difference, because a difference conceals which side moved. Permute the labels and read the mean of the resulting distribution as well as its tail, because a permutation that leaves the estimate unchanged has tested nothing. None of the three is expensive. All three were added late, and the claims they removed had been published for weeks.