rapiDU: A Faster du, and the Measurements du Cannot Make
Contents 5 sections
rapiDU is an open-source command-line tool that answers the
question du is normally reached for — what is taking up all the space? — and then answers four
further questions that du cannot answer at all. It returns the same total as du to the byte, which
is verified on every commit, and on a cold walk of a large parallel filesystem it has been measured
returning that total five to seven times sooner.
pip install rapidurdu # this directory: how big, and what is big inside it
rdu /project/mylab # any other path
rdu -i # rank by file count -- what an inode quota limits
rdu -Q # the quota table, and the age of its figures
rdu -D # space held by files deleted while still open
rdu -a # the full audit: quota + /proc scan + reconciliation
It requires Python 3.6 or later on Linux and has no dependencies at all. That constraint is
functional rather than aesthetic: the situation the tool is written for is a storage emergency on a
login node, where the interpreter is whatever the operating system shipped, the home directory is
already full, and pip may have nowhere to write. The licence is MIT. The command is rdu, chosen so
that the muscle memory transfers — you type du, you type rdu.
This article describes what the tool reports, then argues the case for it against du directly, and
closes by saying where du remains the better choice. Every figure is drawn either from the package’s
own source, tests and recorded benchmarks, or from measurements taken for this article on a production
GPFS filesystem. Where my own measurements disagree with the package’s published figures, both are
shown. No background in high-performance computing is assumed.
A few terms
- A quota is a ceiling on what one user or group may store. It has two independent limits, and either can stop your writes: a block quota on bytes and an inode quota on the number of files. A directory of ten million empty files exhausts the second while using almost none of the first.
- An inode is the filesystem’s record of one file. Several names for one inode are hard links, and they must be counted once rather than once per name.
- A filesystem hands out space in fixed allocation units — 16 KiB on one filesystem measured here, 64 KiB on another. A file therefore has two sizes: its apparent size, the bytes it contains, and its allocated size, the space charged for it. The quota counts the second.
- A parallel filesystem — GPFS, Lustre, BeeGFS — is the shared storage behind a high-performance-computing (HPC) system. It is fast in aggregate and slow per operation: asking it about one file takes far longer than asking a local disk.
- A quota figure is not computed on demand. It is a cached snapshot published periodically by the quota manager, so it has an age, and the age is not usually shown.
- A file unlinked while still open has been removed from its directory but is still held by a running process. It has no name, so no directory walker can find it, and its blocks remain allocated and charged.
Two structural facts drive everything below. First, du measures the filesystem while the limit
that stops your work is the quota — different numbers, computed by different subsystems, at
different times. Second, du reports one figure and never reports its own uncertainty, on a
filesystem where that figure can be wrong by a factor of five for tens of seconds at a stretch.
What rapiDU reports
The same total as du, byte for byte
The first requirement of a replacement for du is that it not be a different answer. Two details
decide this, and getting either wrong produces a plausible wrong number in silence:
- Sum allocated blocks, never apparent size. A single 1 GiB sparse file — an ordinary artefact in machine-learning trees, where checkpoints and preallocated files are common — makes a walker that sums apparent sizes report 4.5× too much on an otherwise unremarkable tree.
- Deduplicate hard links.
ducounts a multiply-linked inode once per run. A Conda environment in the package’s own profiling held 177,300 inodes of which 15,297 were hard-linked: 8.6% of the tree.
The agreement is tested rather than asserted. A continuous-integration job builds a tree containing
hard links, a 1 GiB sparse file and a dangling symbolic link, waits for two consecutive du readings
to agree, then requires du -s --block-size=1 and rapiDU to return the identical integer at 1, 2, 4,
8 and 16 threads. A mismatch fails the build.
I checked it independently on a live 796,980-file, 355 GiB GPFS tree, running the two tools
alternately. Three of the four runs — including one of each tool — returned 381,182,465,024 bytes.
The remaining one, the first du, differed by 512 bytes: one sector, written into the tree between
that reading and the next. The disagreement is the tree changing, not the tools, and it is a small
preview of the third section below.
That framing governs the rest of this article: rapiDU is faster than du and reports more than
du. It is not more accurate than du, and any claim that it is would be a bug.
Speed, and the honest shape of it
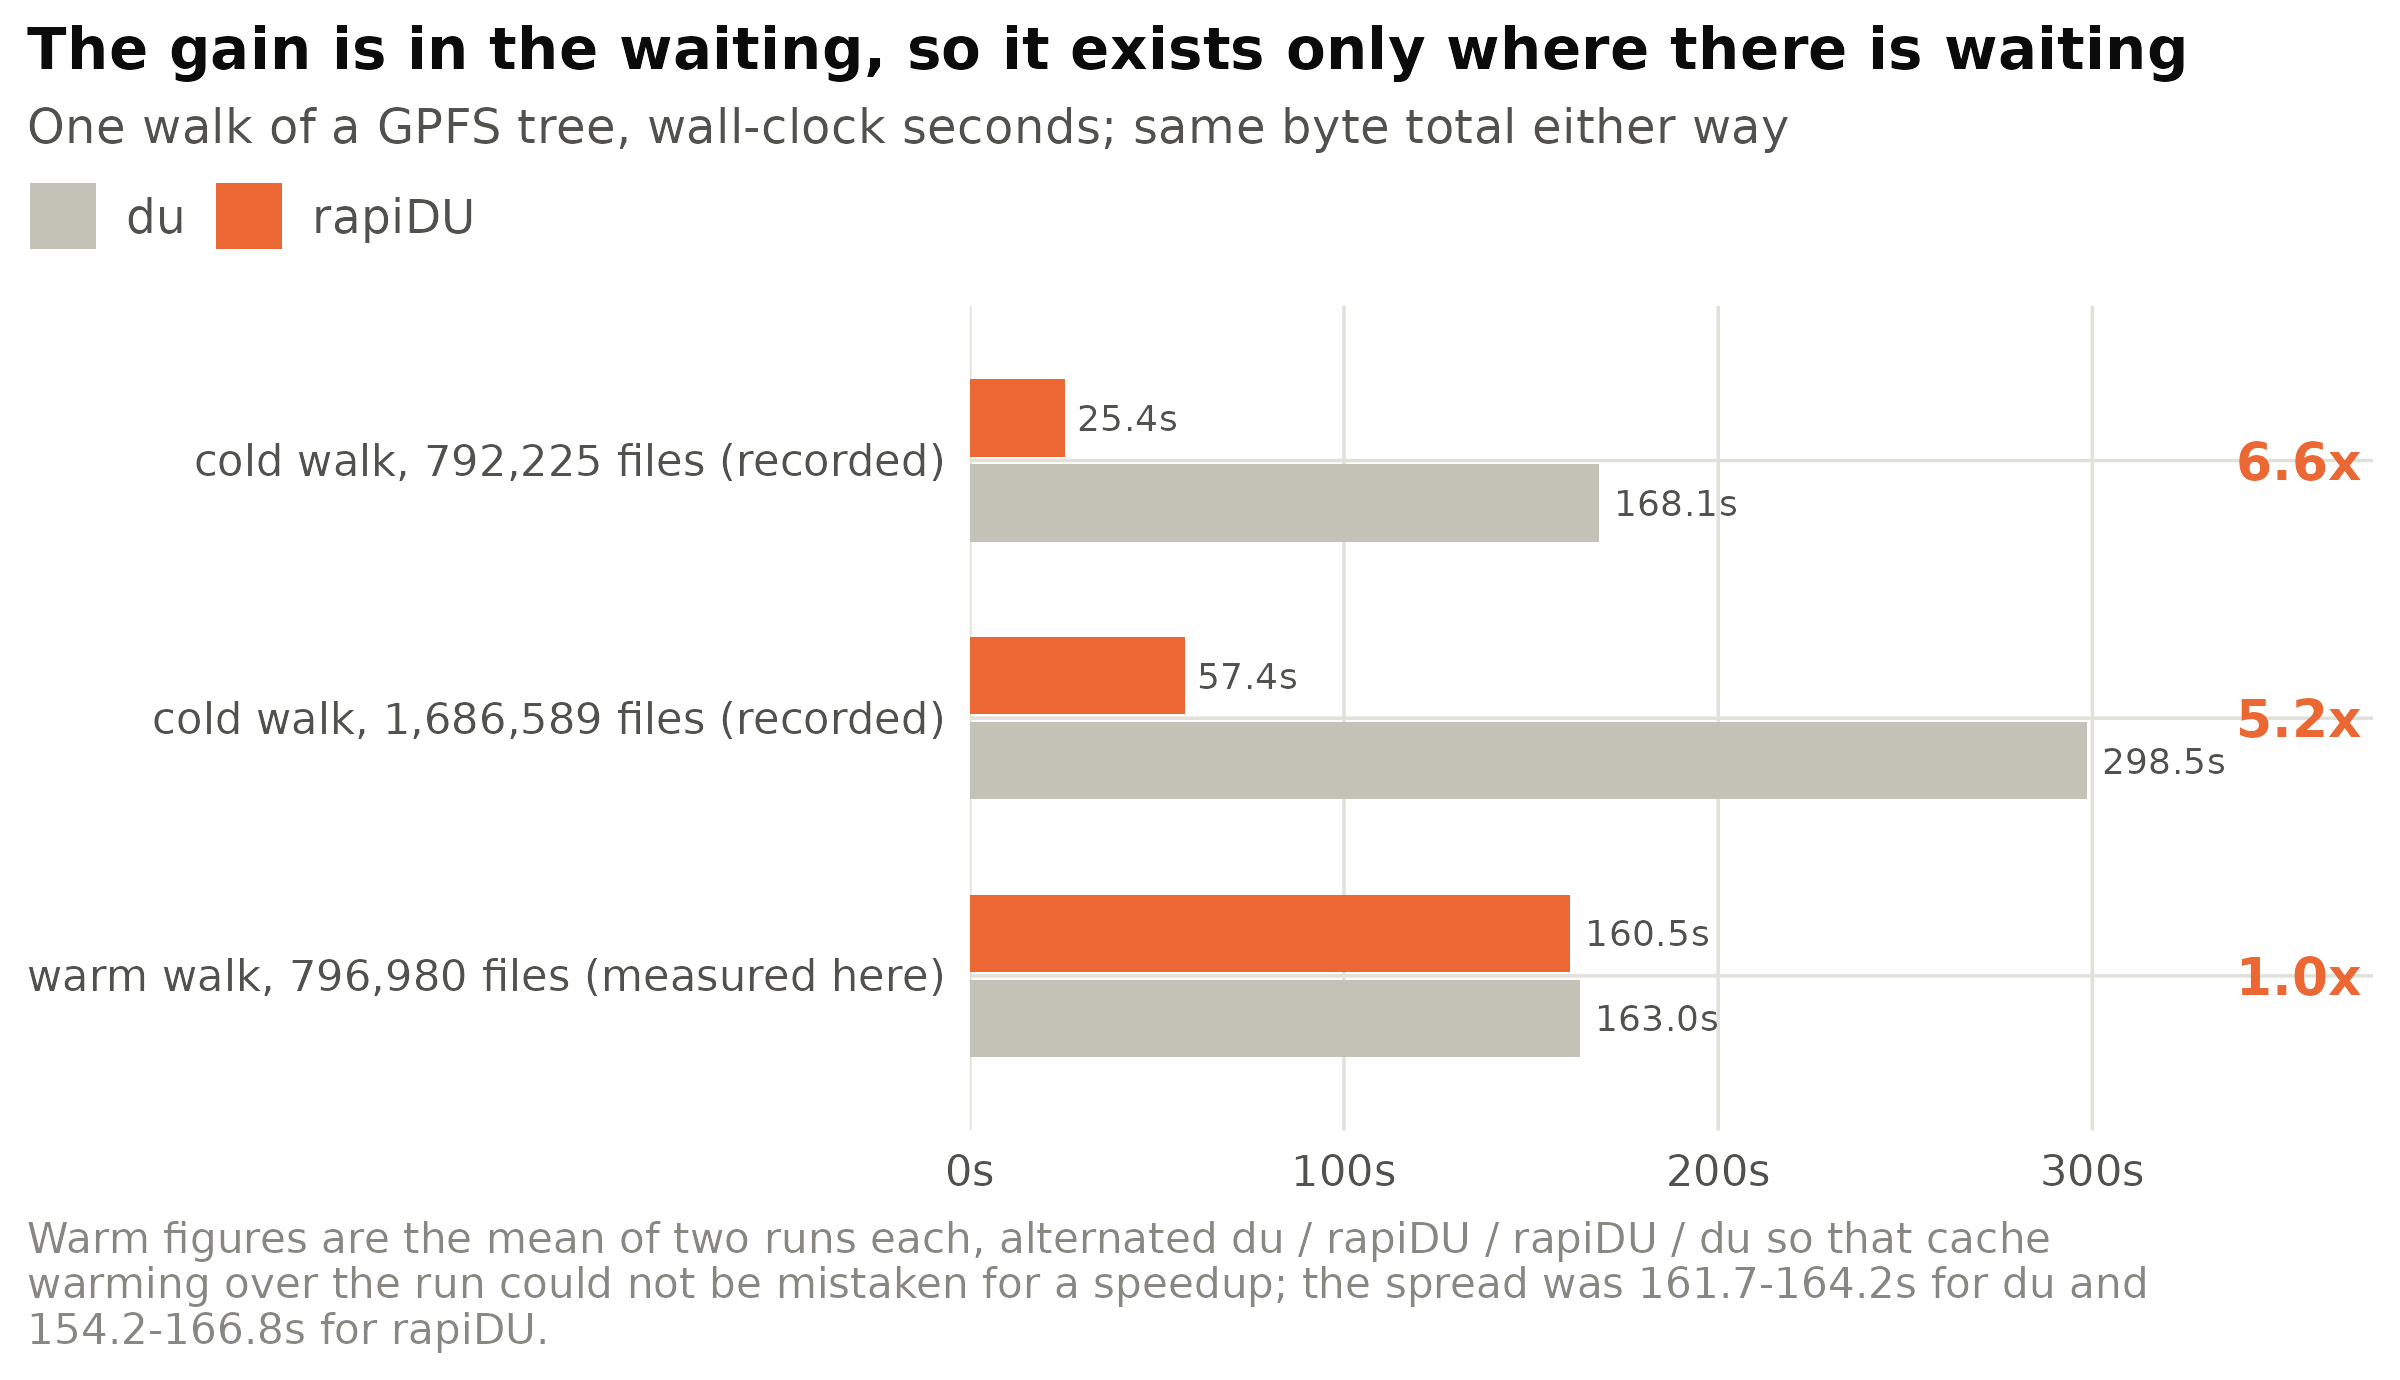
Figure 1: Wall time for one walk of a large GPFS tree, du against rapiDU, in three conditions. The top two rows are the package’s recorded cold-walk benchmark. The third is my own measurement on a comparable tree whose metadata was already cached, where the advantage disappears entirely. Both tools returned the same byte total in every condition.
du is single-threaded, and on a cold parallel filesystem roughly 95% of its wall time is not
computation but waiting — each stat call is a round trip to a metadata server, measured at about
570 microseconds of blocked thread time per file. Concurrency is therefore nearly free, because the
threads are not competing for a processor but queueing for a network service.
The third row of that figure is the necessary corollary, and I include it because it is the result I actually got rather than the one I expected: where there is no waiting left to overlap, the two tools converge to within 2%. The package’s own documentation takes the same position and refuses to publish a constant. Re-measured across three trees, the equivalent speedup for its stat-free mode was 8.5× on a large cold GPFS tree, 2.1× on a page-cached local one and 1.6× on a small warm GPFS one — and using any one of those to predict a runtime elsewhere was out by −74% and −80% on two of the three.
Because that mechanism is a claim about the filesystem rather than about the code, it is worth testing directly, and the result was not the one I expected.
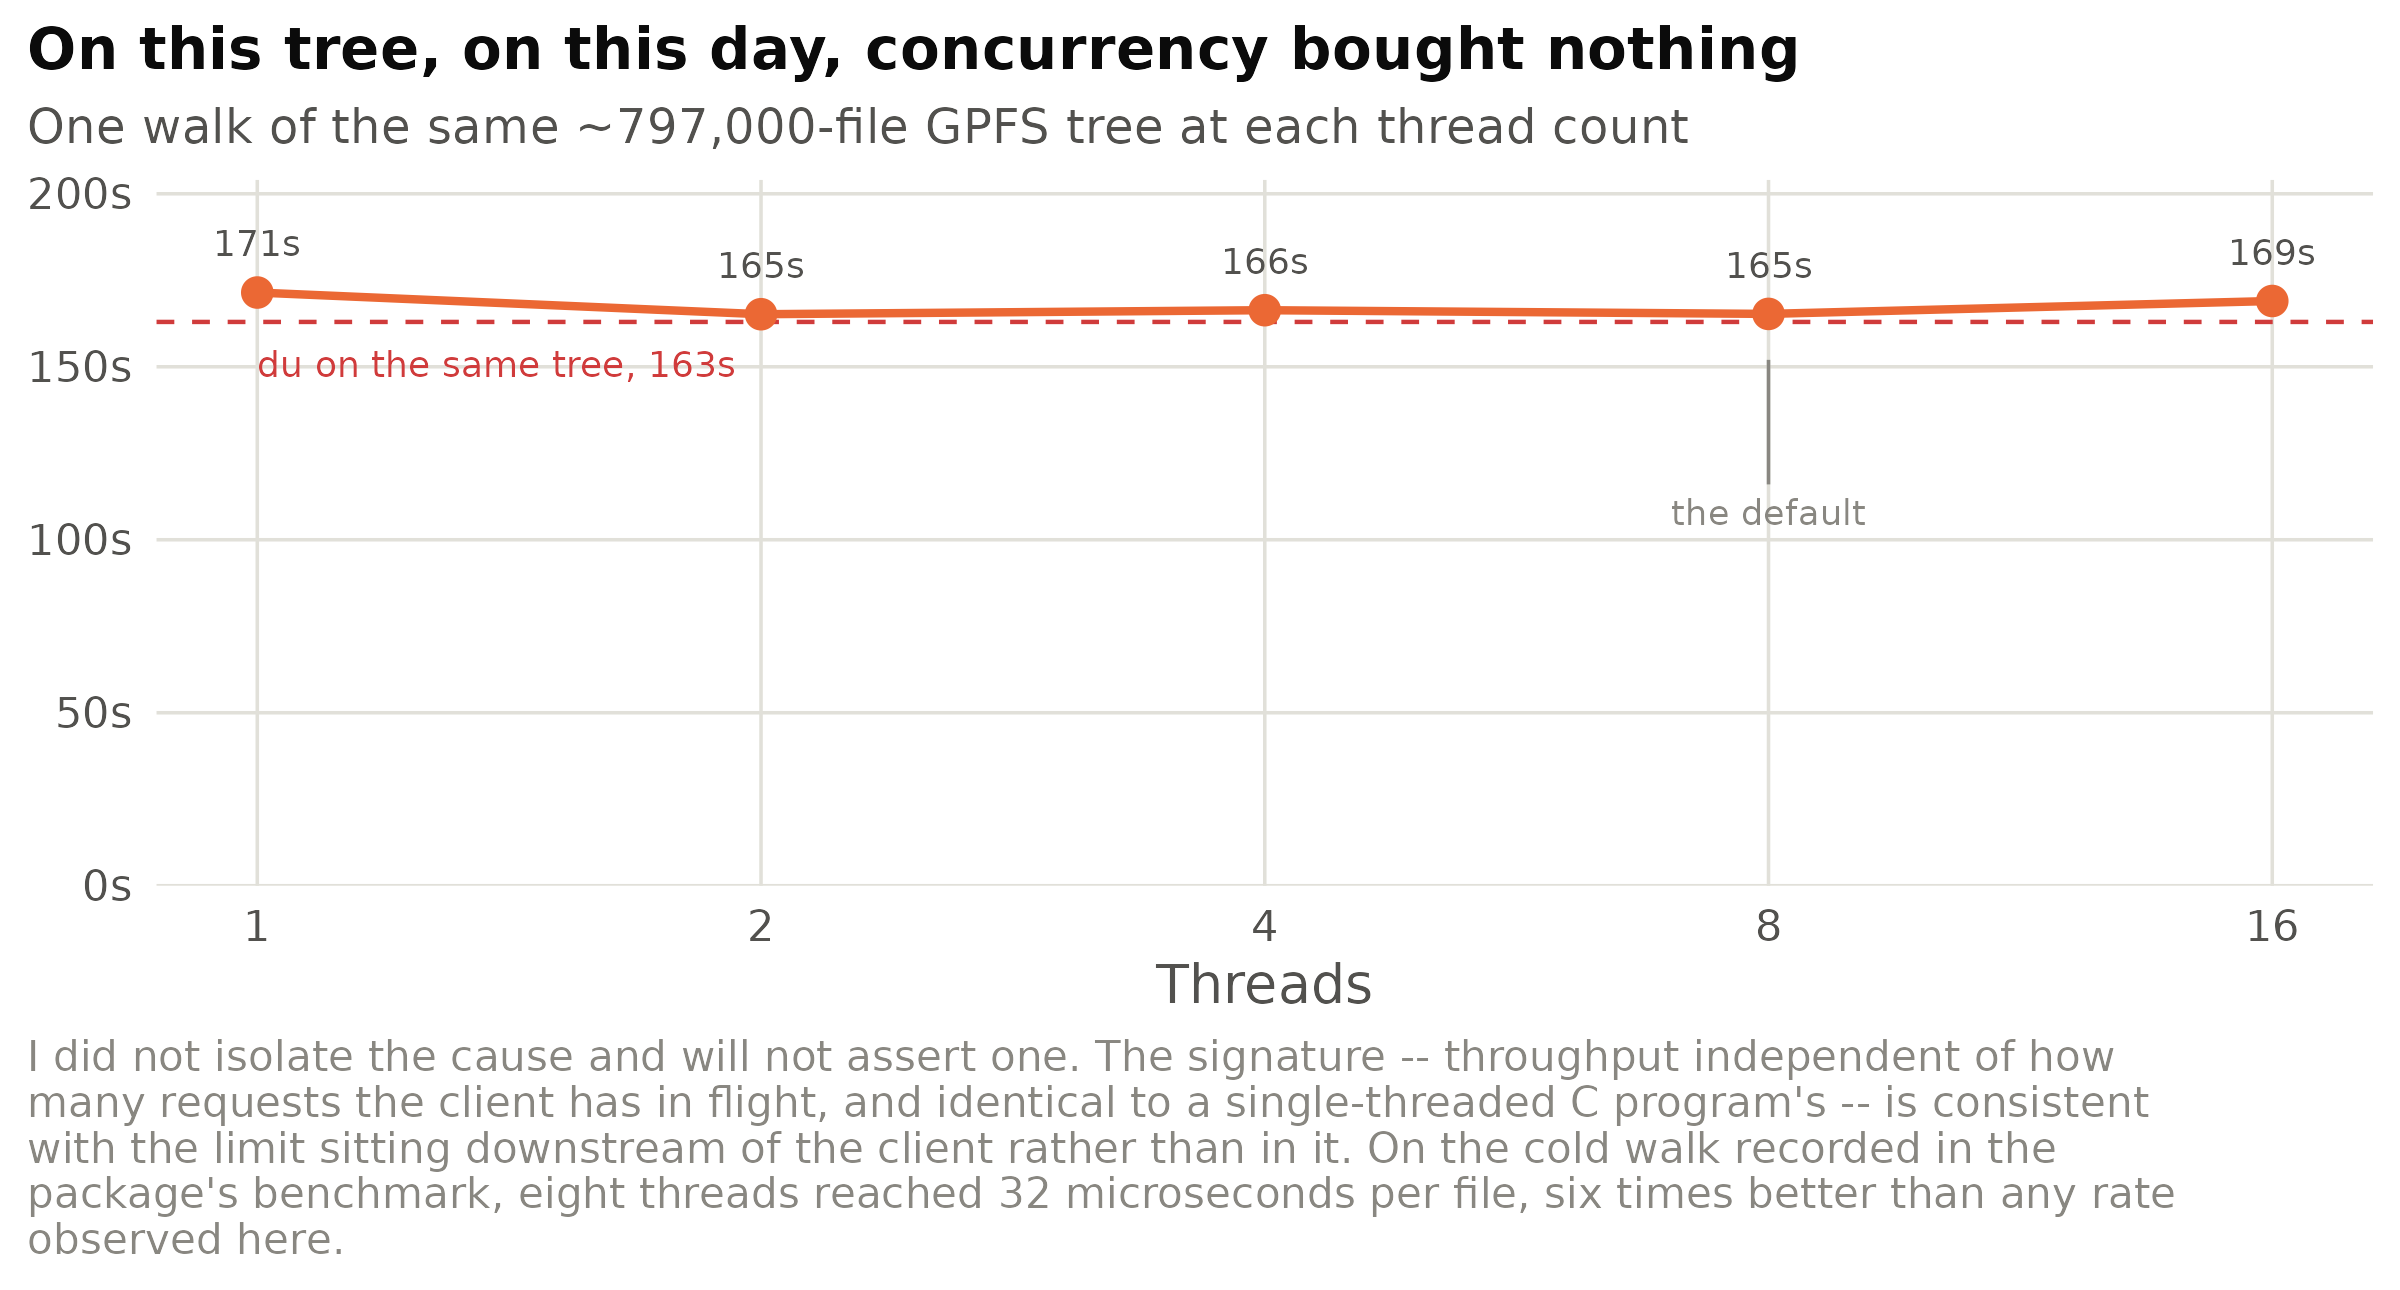
Figure 2: Wall time against thread count for one walk of the same GPFS tree, measured for this article; the sweep saw 796,982 inodes, two more than the comparison above, because it is a live directory. The dashed line is du’s time on that tree. The sweep ran in descending thread order after a warm-up walk, so residual cache warming works against the conclusion rather than for it, and every thread count returned the identical byte total. Sixteen threads bought nothing over one: the per-file cost stayed pinned near 210 microseconds throughout, which is also precisely du’s rate.
I am reporting this because it is what the instrument said, and because the alternative — quoting the package’s benchmark and stopping — is the failure mode this whole article is about. Two conclusions follow, and they point in opposite directions. The speedup is real: it was measured, it is reproduced in the package’s continuously rendered benchmark, and 32 microseconds per file at eight threads is not obtainable by any single-threaded means. But it is contingent on the filesystem letting you overlap requests, and on the tree and day above it did not. Anyone choosing a tool on the strength of a speed figure should measure it on their own filesystem, which is precisely why the package publishes no constant and attaches a filesystem to every ratio it does publish.
The cap at sixteen threads is a hard clamp rather than a suggestion: the package’s own earlier measurement found 32 threads 31% slower than 16. It is also an etiquette control, and the package is explicit about that. A metadata-heavy walk of a shared filesystem is load on a service every other user depends on — precisely the sin the tool exists to diagnose — so the fast setting and the considerate setting are made to be the same setting, and requests above the cap print their reason for being reduced.
A second, larger gain is available when the question is about file counts rather than bytes, because
then no stat call is needed at all: the directory read already distinguishes a directory from
everything else.
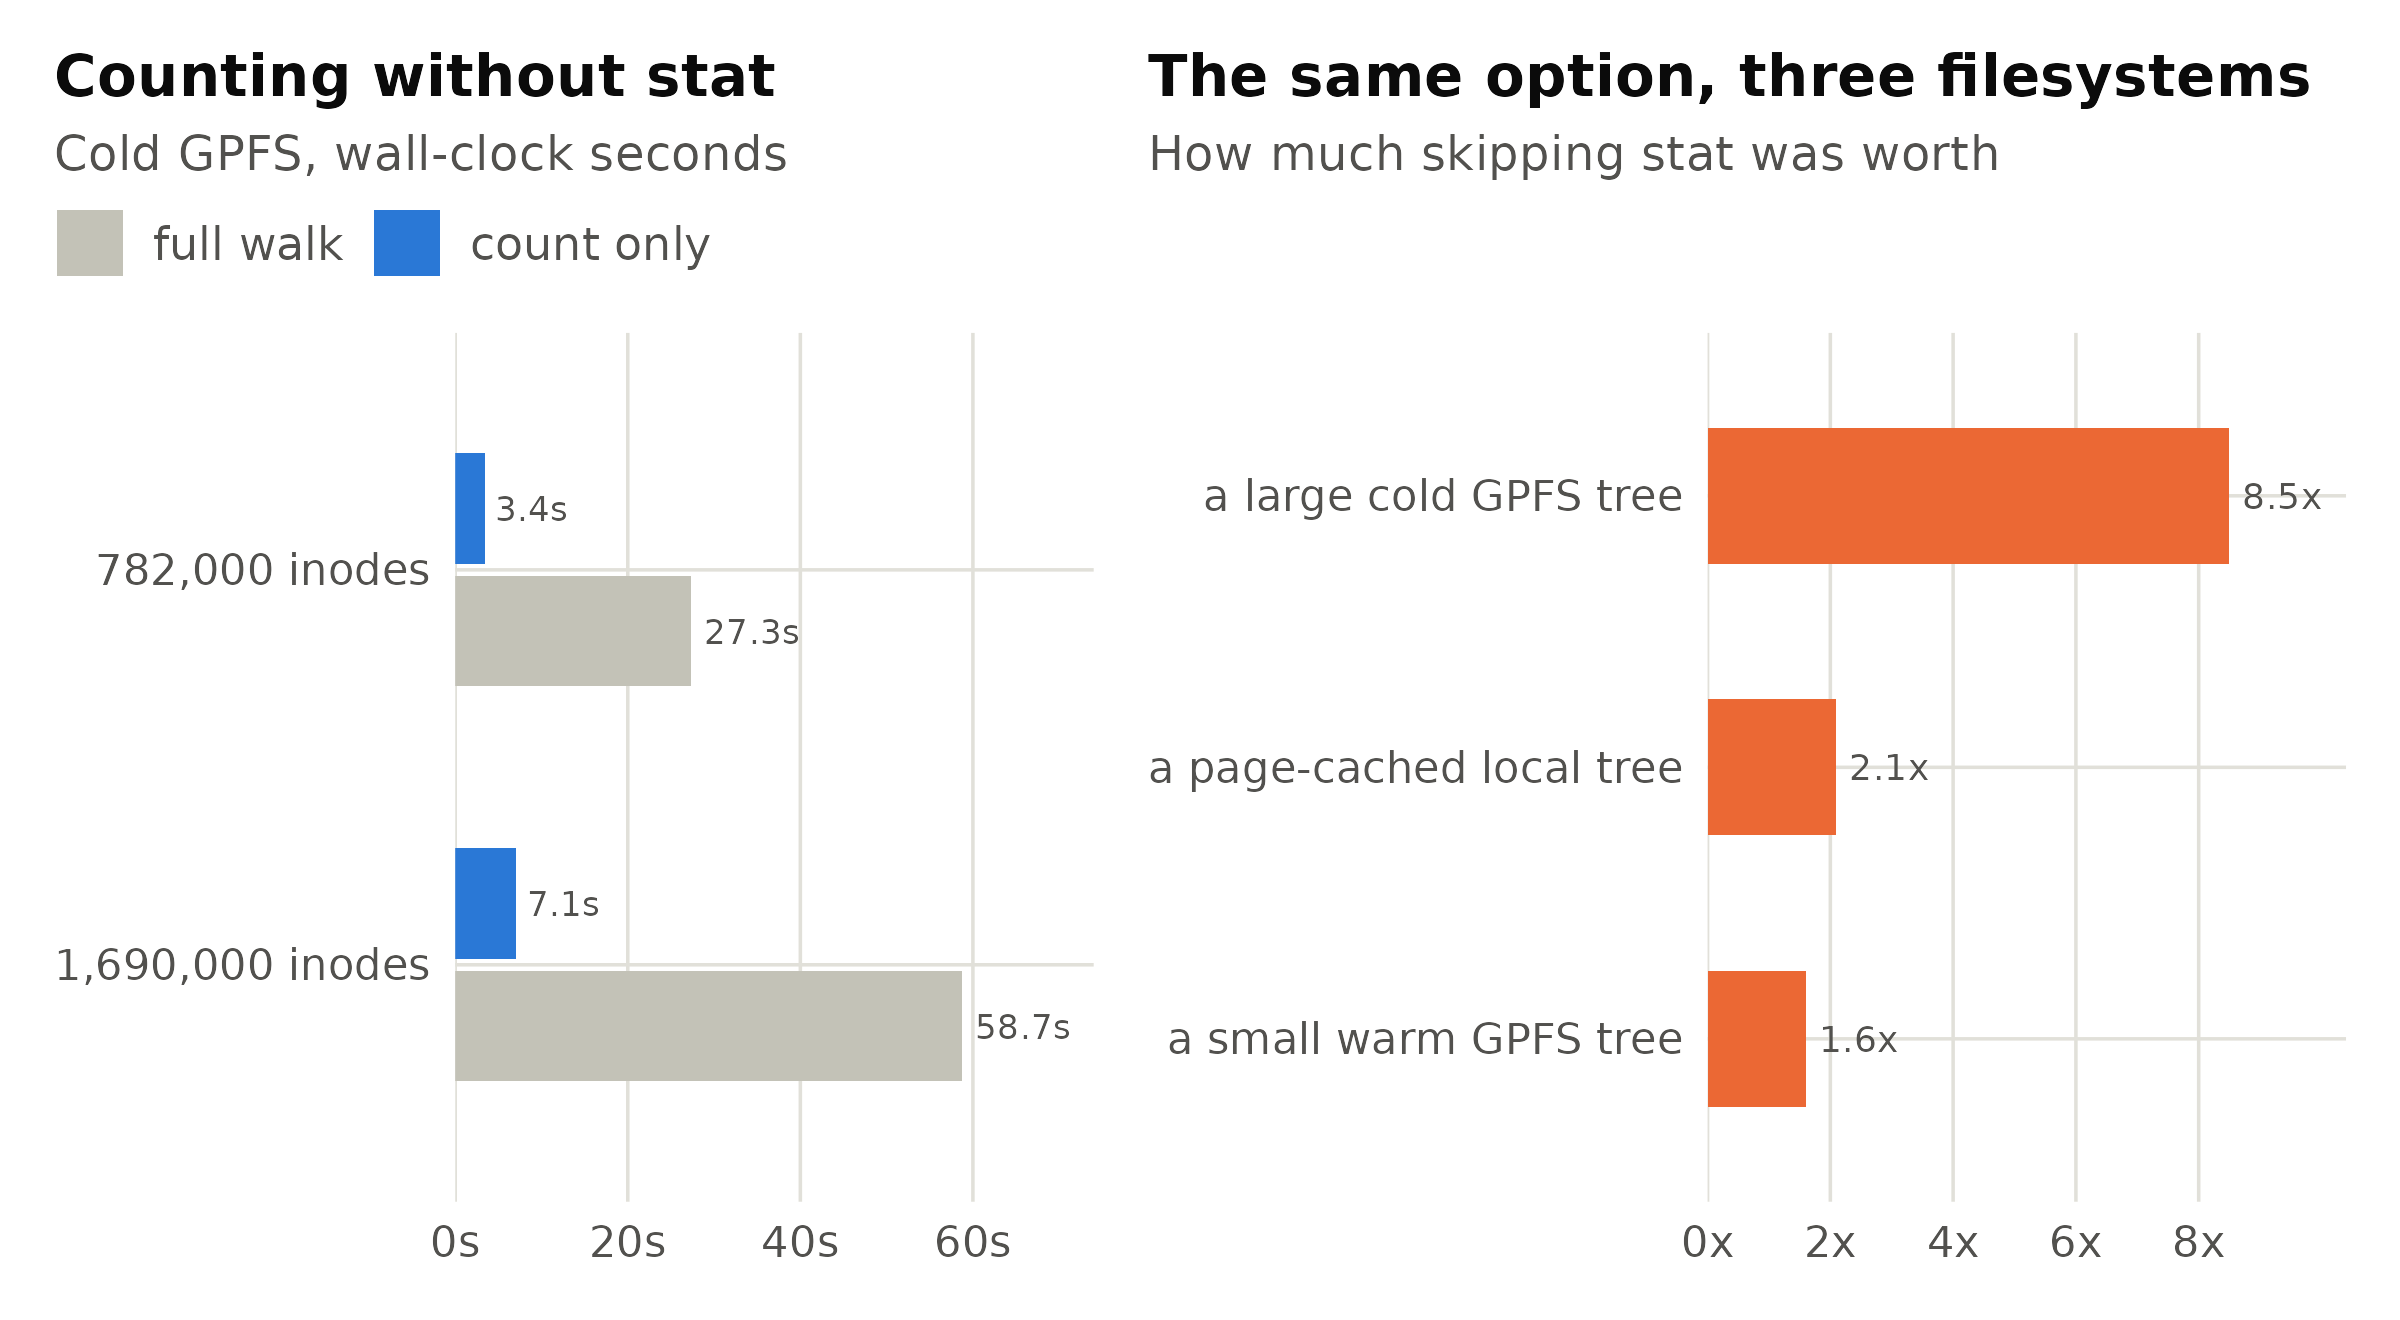
Figure 3: Left: what skipping stat is worth on two cold GPFS trees, where stat is roughly 90% of the walk’s wall time. Right: the same option re-measured on three trees, showing that the ratio is a property of the filesystem and its cache state rather than of the tool. The package therefore states the figure with the filesystem it was measured on attached, and declines to convert it into a predicted runtime.
Where the bytes are, and where the inodes are
The default report is one screen: the tree’s total, its file count, the time the walk took, and a ranked breakdown of what is inside it.
╭───────────────────────────────────────────────────────────────────────────────────╮
│ /project/lab/shared                                                               │
│ 1.4 TiB  ·  5,435 files  ·  4.12s                                                 │
│                                                                                   │
│   ──────────────────────────────────────────────────────                          │
│         size  share                           files  entry                        │
│    661.5 GiB  █████▏░░░░░░░░░░░░   31.9%        350  checkpoints/                 │
│    343.8 GiB  ██▊░░░░░░░░░░░░░░░   16.6%        968  datasets/                    │
│    470.9 GiB  ▒▒▒▒▒▒▒▒░░░░░░░░░░   22.9%      4,117  (84 more — use -n 0 for all) │
╰───────────────────────────────────────────────────────────────────────────────────╯
Three decisions there each fix a way a ranked listing normally misleads. The hatched final row is
everything not shown, and it names how many entries that is — so a truncated table always declares
itself truncated instead of implying the top ten are the whole tree. The bar and the percentage beside
it are one measurement in two forms, computed against the whole walk, so they cannot disagree. And the
column you sorted by is the one in colour: under -i the file count takes the emphasis and the size
steps back.
That -i is not a cosmetic alternative. An inode quota is a separate ceiling, reached by entirely
different trees, and a tree that exhausts it is often unremarkable by size. Sizes in the table are
cumulative, so any row agrees with du -s on that path.
Four things du cannot report
Everything above is a faster du. What follows is not du at all. Each of these four is a
measurement du structurally cannot make — not a gap in its interface, but a fact outside the set of
things a directory walk can observe.
1. The gap between what a tree holds and what it is charged
Because space is handed out in fixed units, a tree of small files is charged for padding it never
uses. du reports the charged figure and du --apparent-size reports the other; neither reports the
ratio, which is the actionable quantity, and nobody runs both.
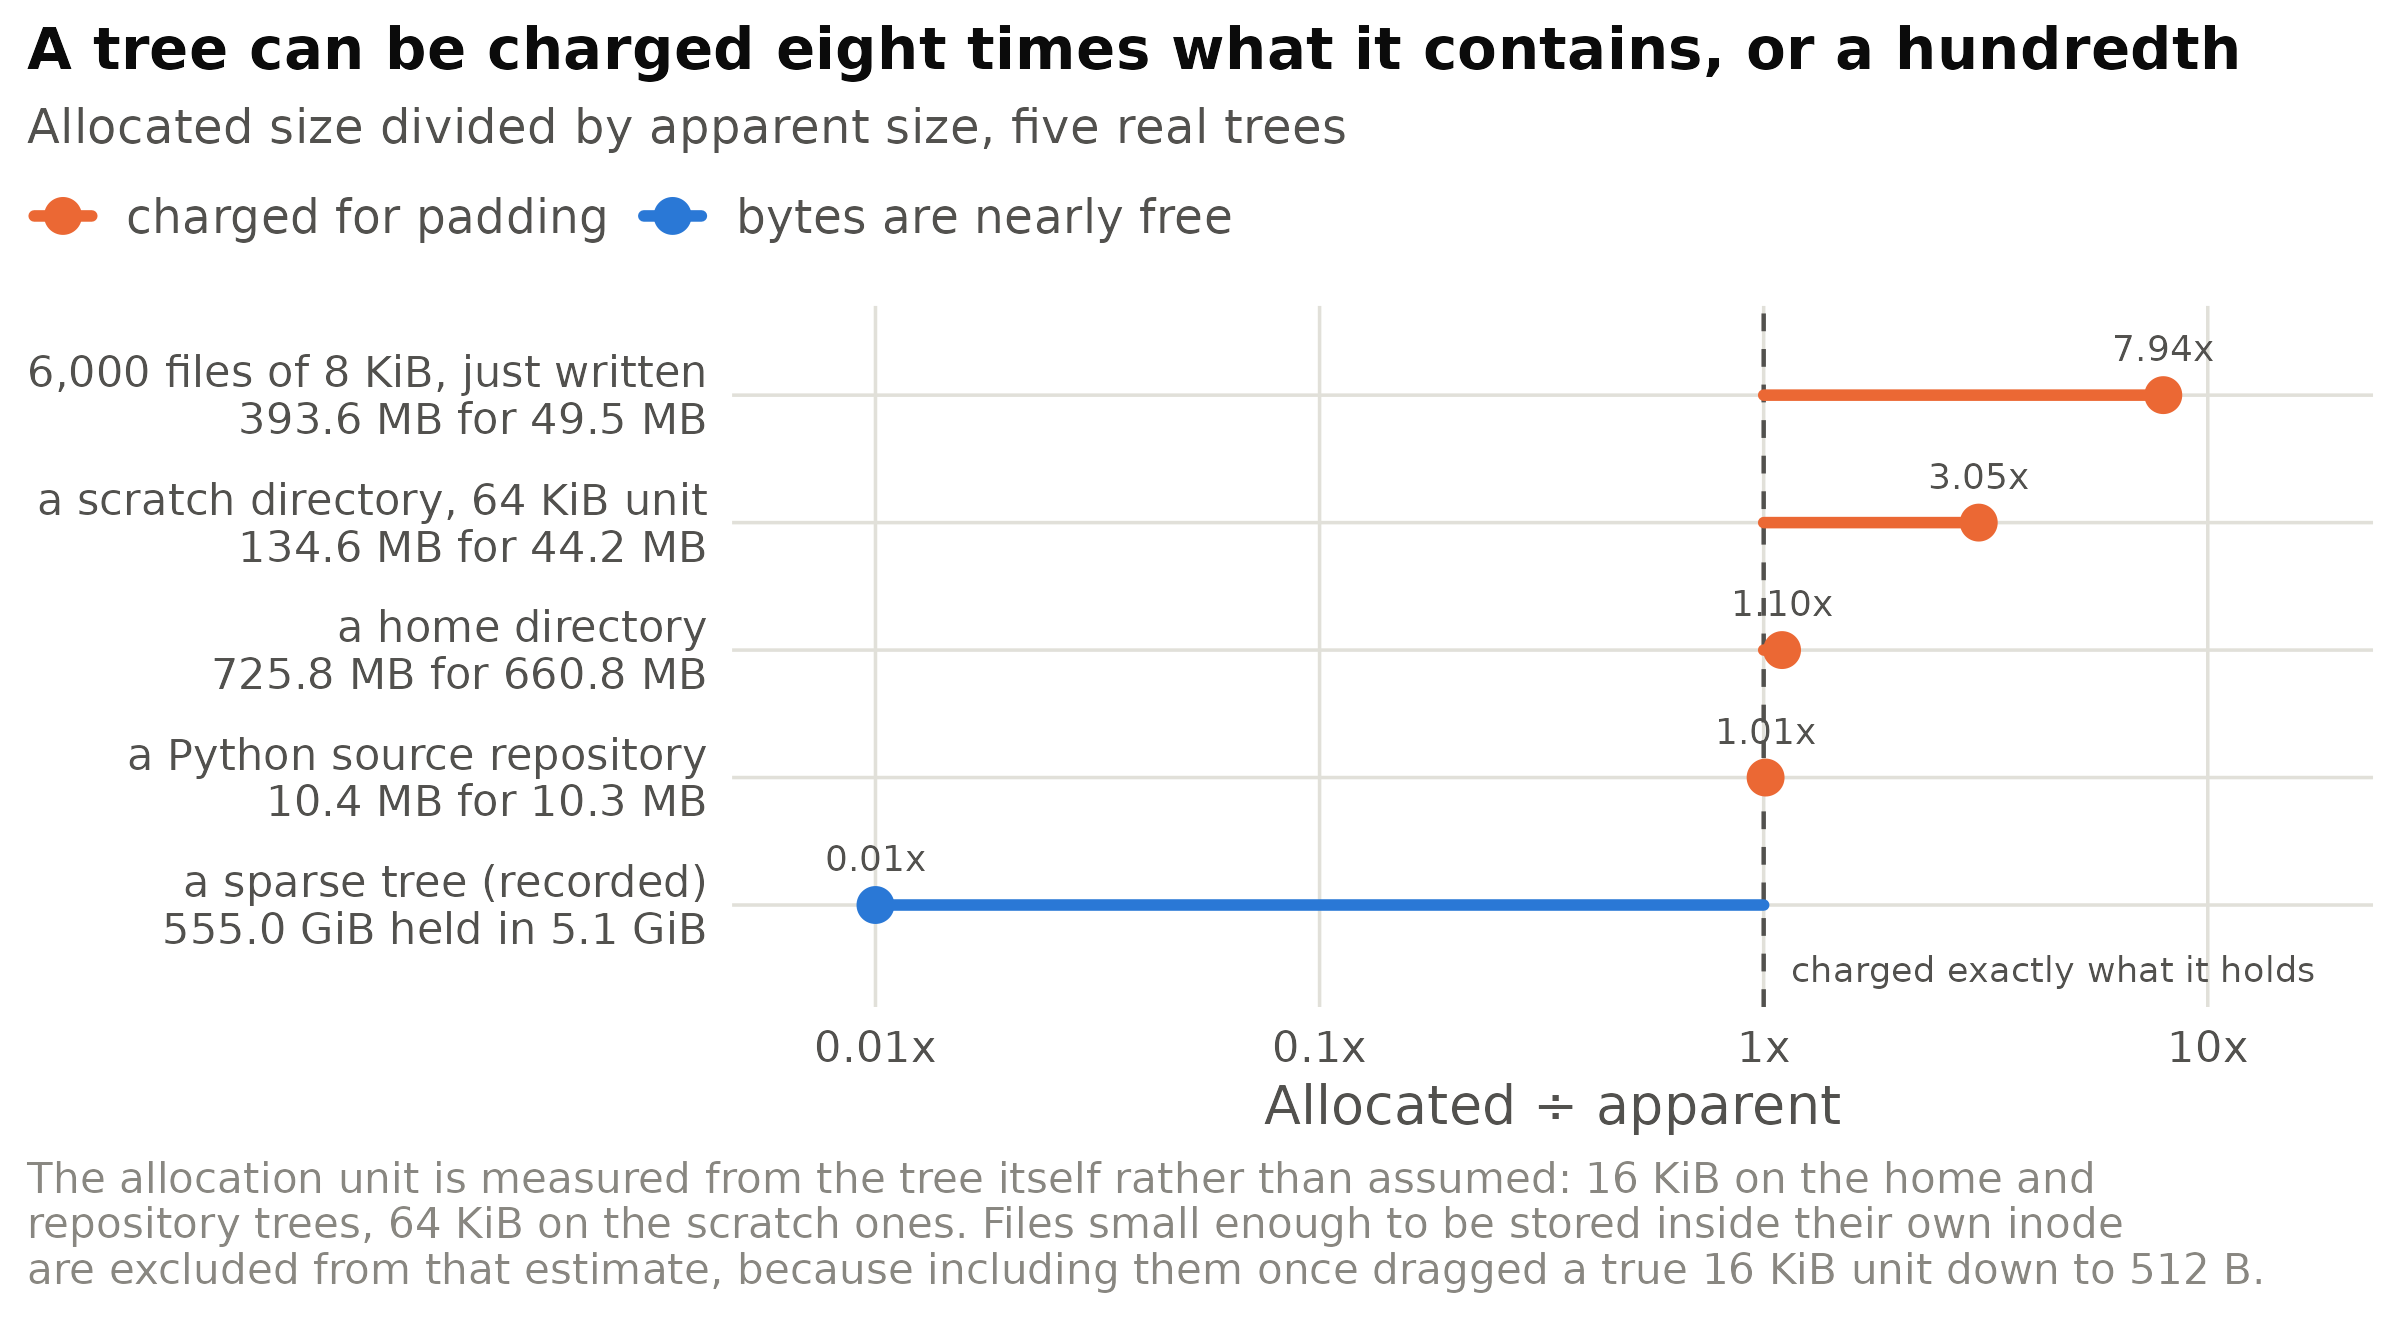
Figure 4: How much each tree is charged for what it holds, on a log axis, with the dashed line marking a tree charged exactly its contents. Four were measured for this article; the sparse case is the package’s own recorded measurement. Above the line the excess is recoverable padding, because every file smaller than the allocation unit pays for the whole unit. Below the line the data is sparse or compressed, bytes are nearly free, and rapiDU deliberately declines to call it a problem.
The two directions are not symmetric, and the tool treats them differently on purpose. Allocated above apparent is padding, and it is recoverable: the report names the mean file size, the allocation unit, the total padding, and the fact that packing the files into one archive returns it. Allocated below apparent is not an error, and reporting it as one would be a false alarm — so that branch says bytes are cheap here and points instead at the inode count, which is the limit that will actually bind.
2. That the number is still moving
This is the finding that most changes how one reads a du output, and it is the least known. On a
parallel filesystem, blocks for a freshly written file are not allocated at the moment of the write.
The figure a walker reads immediately afterwards is provisional, and it converges over tens of
seconds — in either direction.
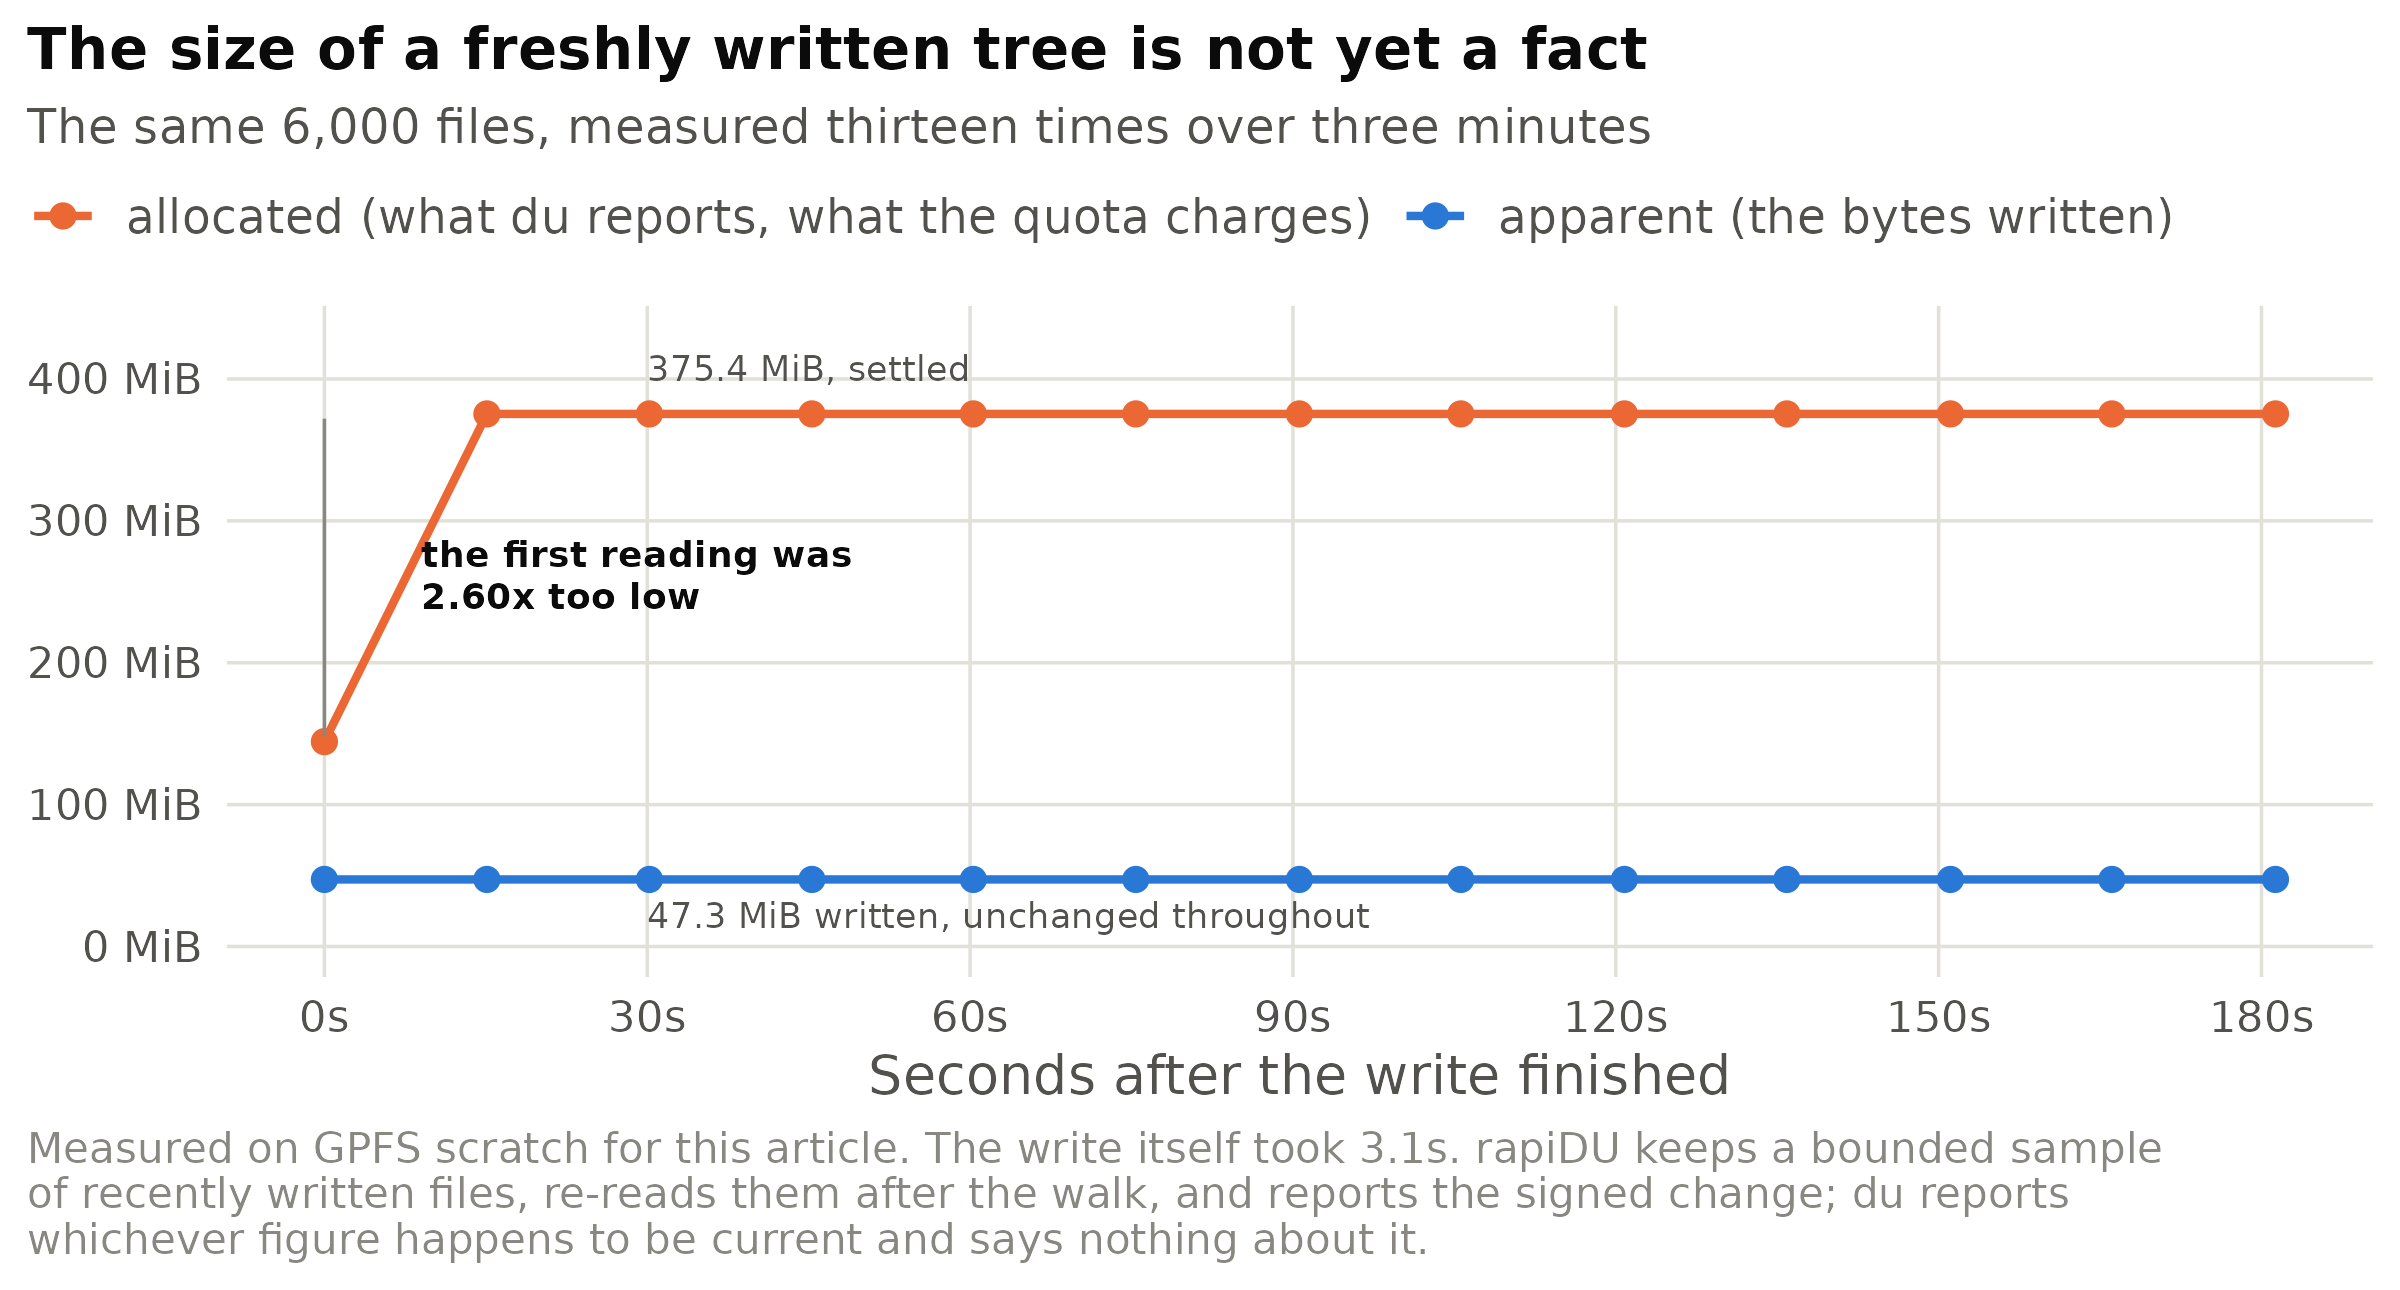
Figure 5: One tree of 6,000 files of 8 KiB each, written to GPFS scratch and then re-measured every fifteen seconds for three minutes. The charged total rose by 160% within the first fifteen seconds while the bytes actually written never changed at all. A reader who ran du in the seconds after the write would have taken away a number the filesystem had not finished computing, with nothing to indicate it.
Both directions have been recorded on this filesystem, and the second is why a checker that watches only for growth is insufficient.
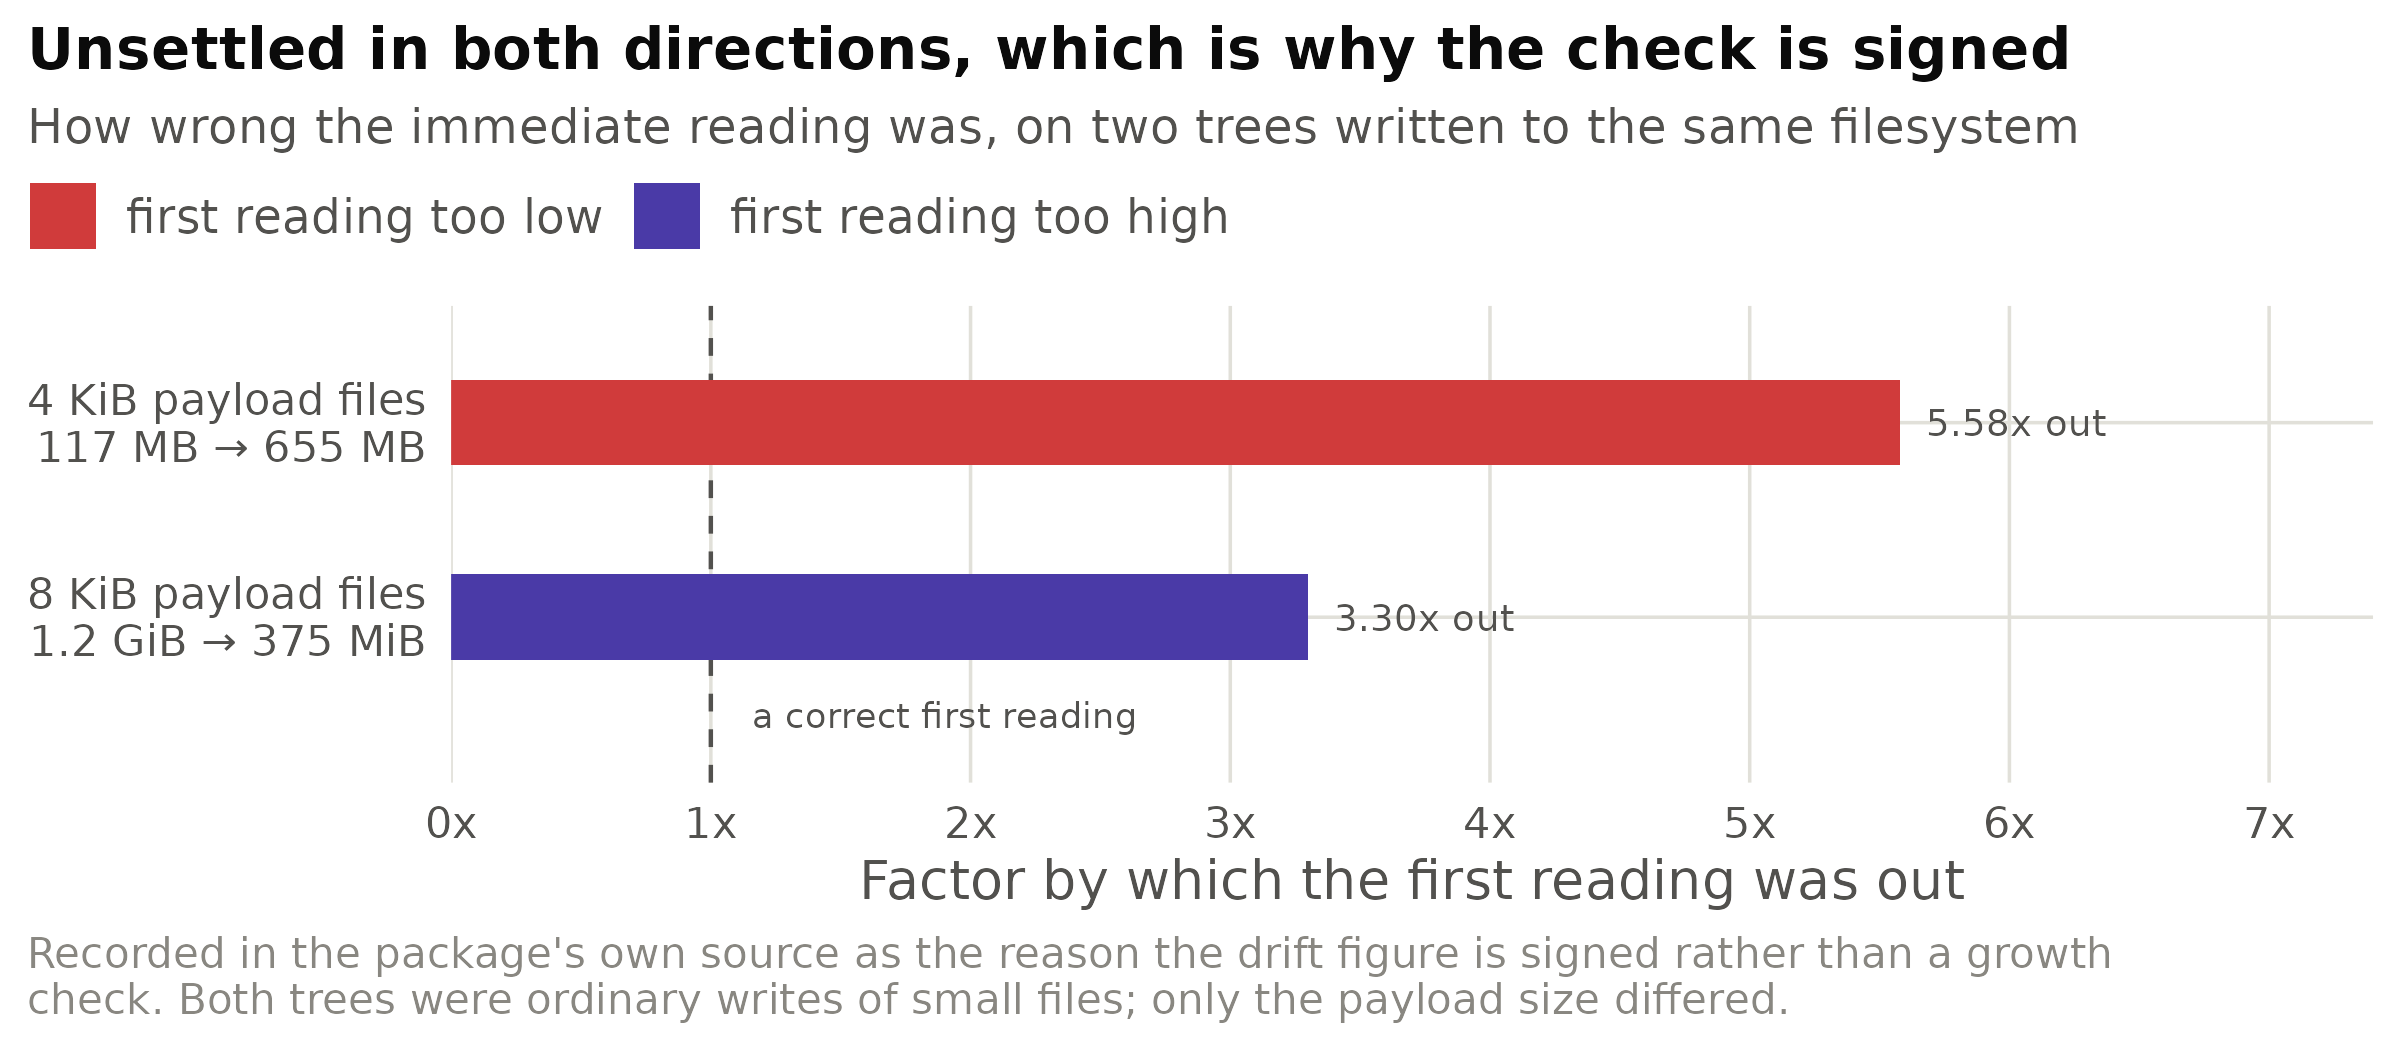
Figure 6: Two recorded settling incidents on the same filesystem, in opposite directions, plotted as the factor by which the first reading was wrong. Delayed allocation makes the first reading too low; transient over-allocation compacting down to the subblock size makes it too high. A tool that watched only for growth would have called the second tree settled during a window in which its number was falling by hundreds of megabytes.
Two refinements make that check trustworthy rather than decorative. Only files present in both
readings contribute to either side of the subtraction, so a truncated sample cannot manufacture a
phantom figure. And because the blocks move over tens of seconds, an immediate re-read cannot see the
effect at all: with no waiting period the tool reports its own check as inconclusive and falls back
to warning that files were written recently. --settle-wait 60 measures the drift instead of merely
suspecting it.
The underlying habit is worth stating separately, because the whole package is built around it: before believing a null result, ask whether the instrument could have seen the effect.
3. The age of the quota figure you are comparing against
When storage fills, the number that matters is the quota manager’s, not the walker’s. That number is a periodic snapshot and its age is normally invisible.
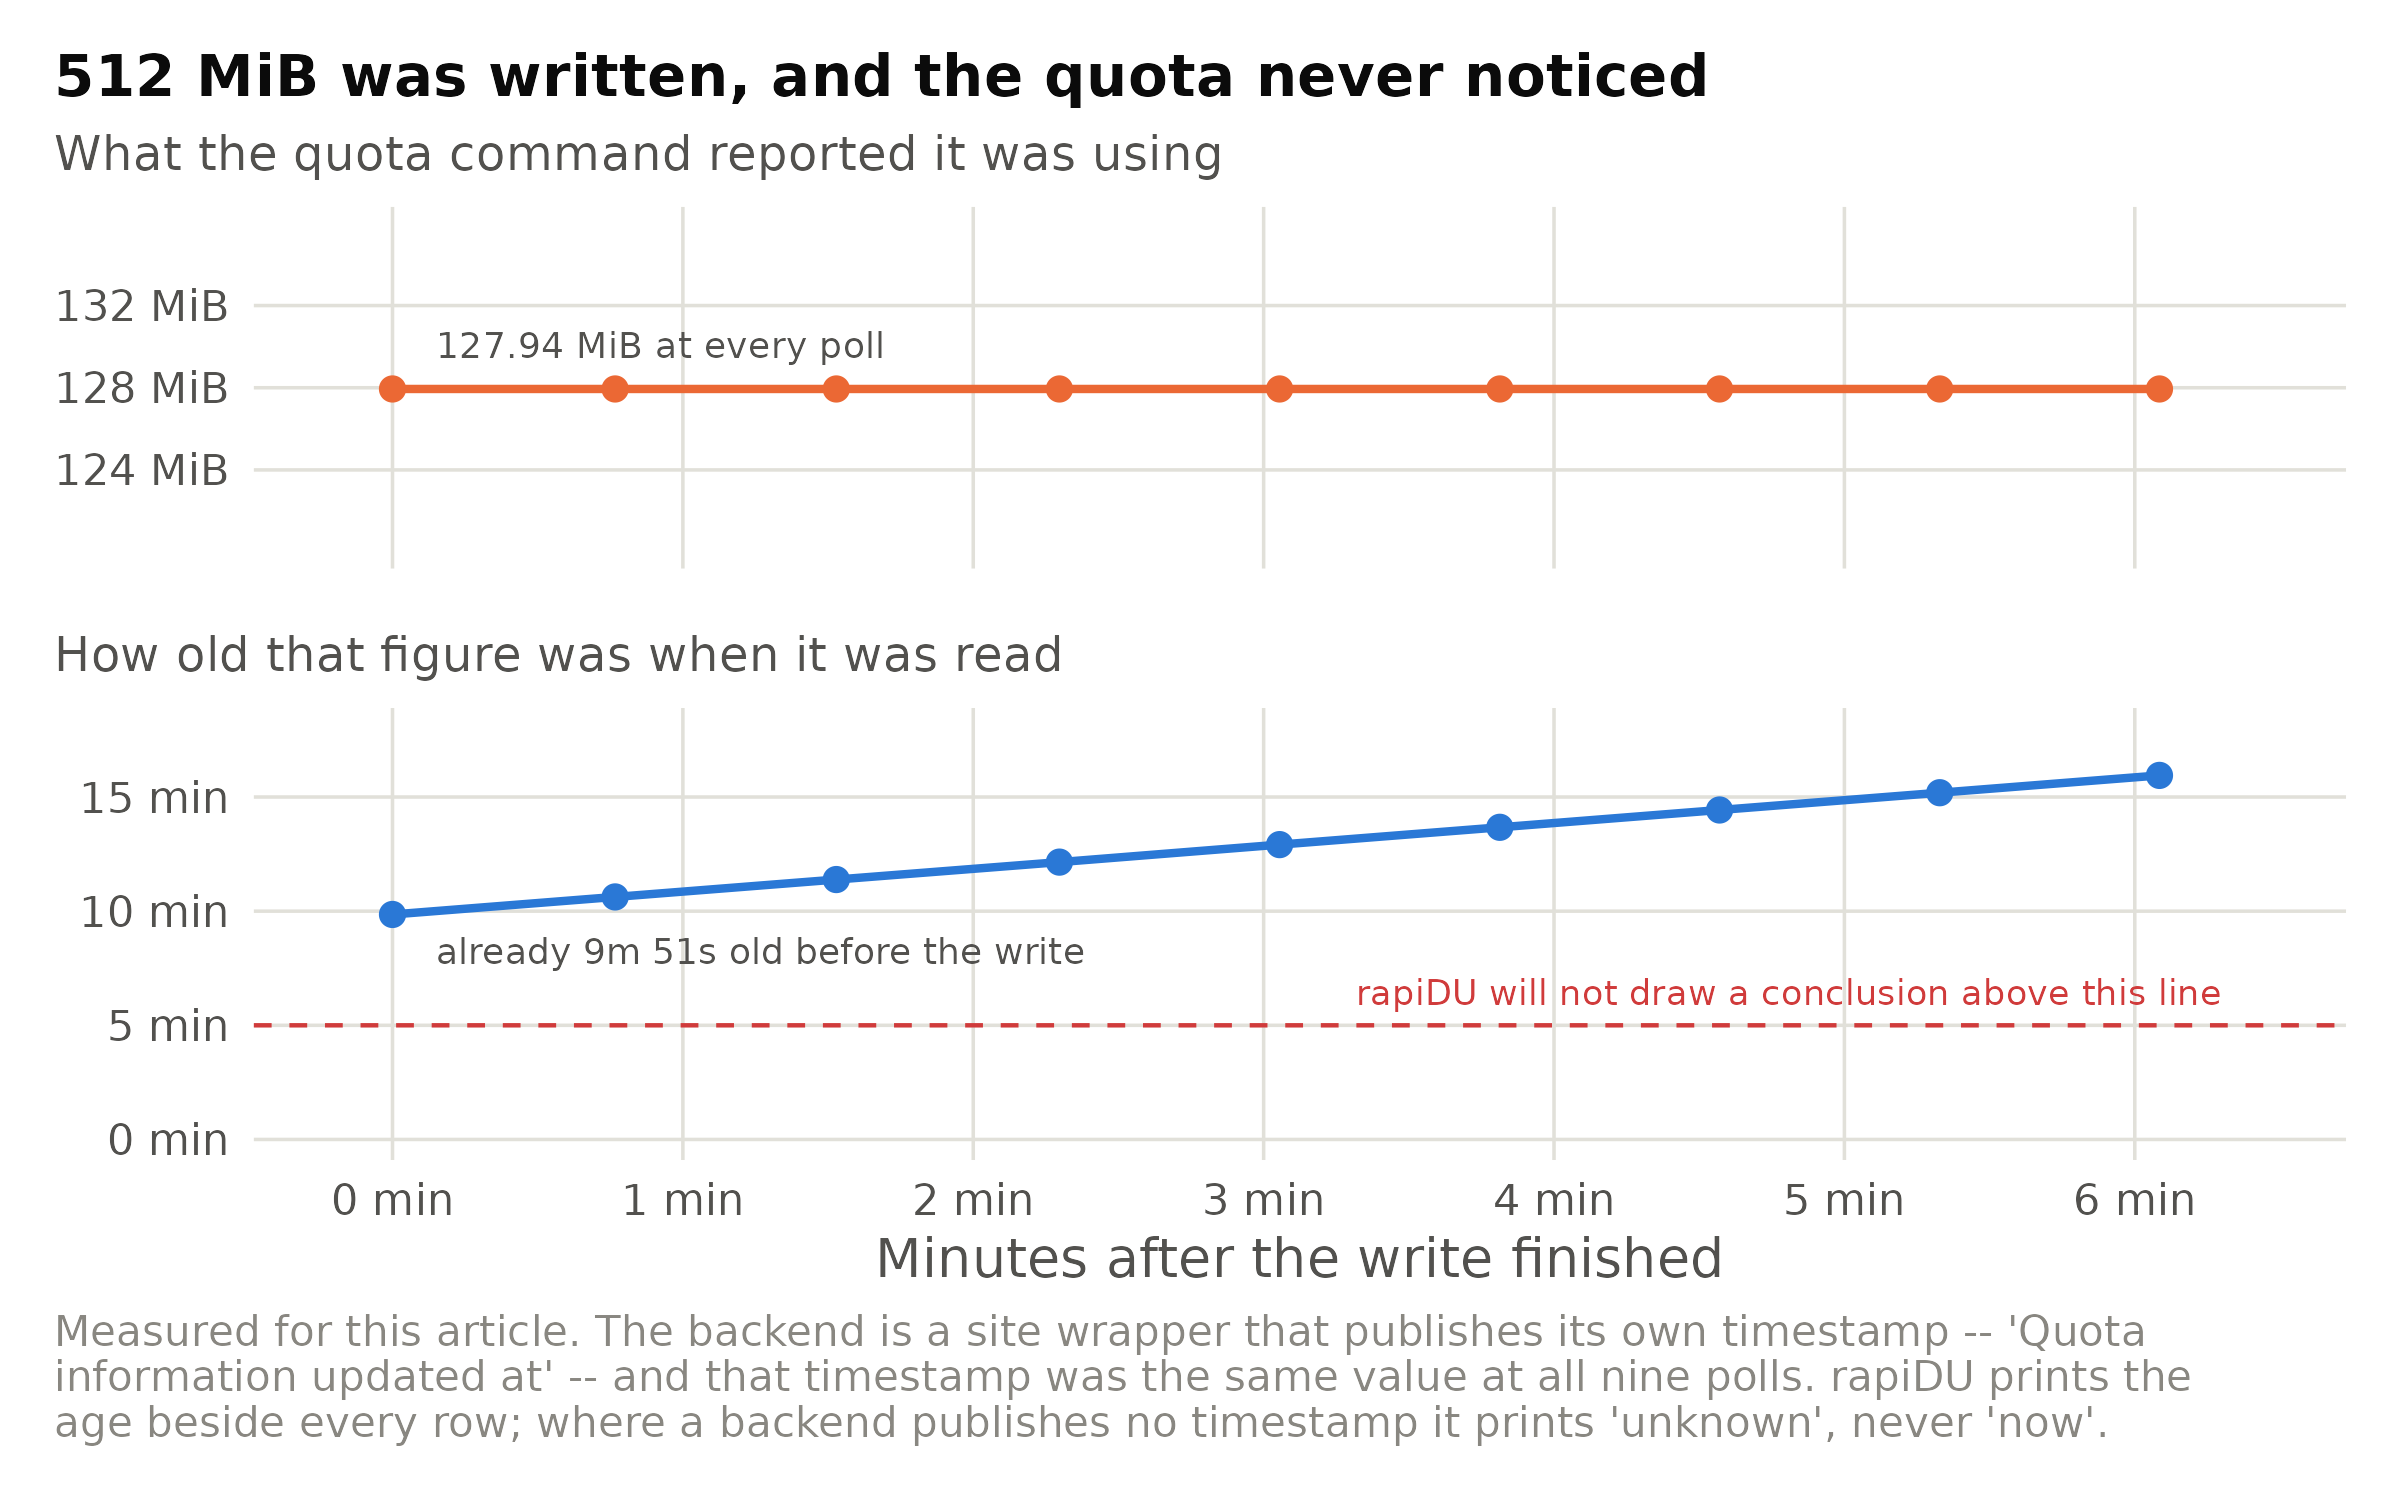
Figure 7: 512 MiB written and fsync’ed to a GPFS scratch filesystem, then the site quota command polled nine times over the following six minutes. Upper: the figure the quota reported, which did not change by one byte. Lower: how old that figure was at each poll, against the five-minute threshold above which rapiDU refuses to base any finding on it. The timestamp the backend published was identical at all nine polls, so this is one snapshot ageing rather than a series of readings.
This is a support-request pattern rather than an occasional curiosity. In the ticket record that motivated the package, “my quota is delayed, cached, or not refreshing” accounts for 217 requests at a median resolution time of 38.0 hours, and “I deleted files but my quota did not change” for a further 48 at a median of 74.8 hours. Almost none of those are faults. They are a displayed number with no timestamp beside it.
So rapiDU reports every quota reading with the age the backend itself published, and where the backend
publishes none it reports the age as unknown — never as now. It also declines to “correct” a
timestamp whose timezone looks wrong: it says the age looks suspicious and leaves the number alone,
because a silent correction is a guess wearing the clothes of a measurement.
4. Space held by files that no longer have a name
A file unlinked while a process still holds it open has no directory entry. It is invisible to du, to
ls, to ncdu, and to rapiDU’s own walk — all of which work by reading directories. Its blocks remain
allocated, and on a quota-enforced filesystem they remain charged.
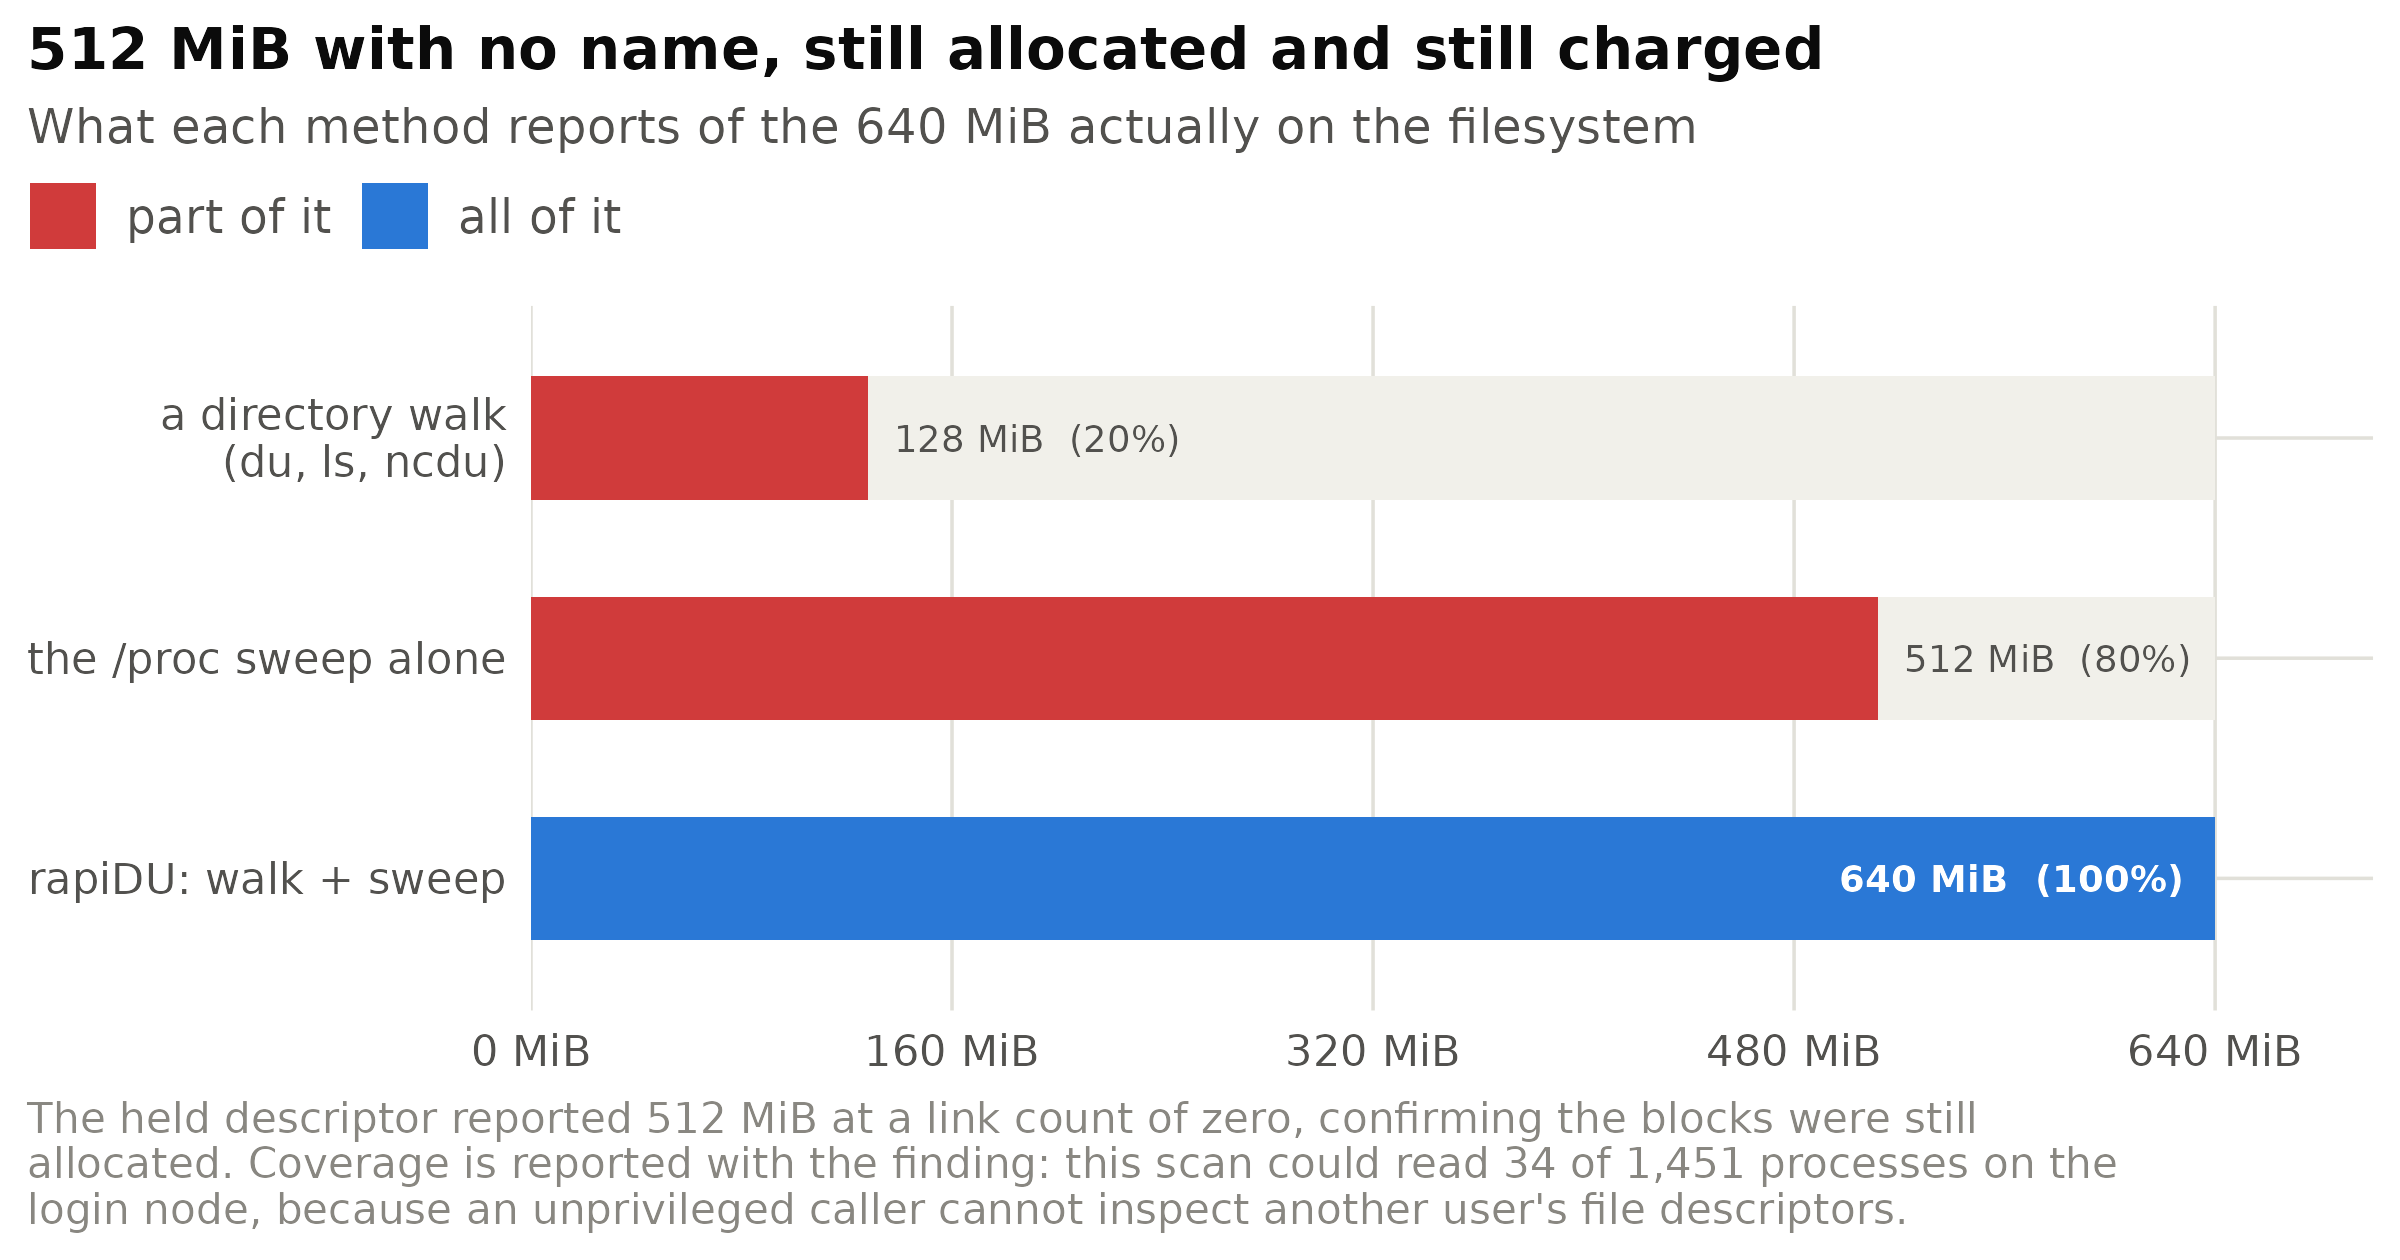
Figure 8: A reproduction run for this article on GPFS. 512 MiB was written, fsync’ed, and then unlinked with the file descriptor still held, alongside 128 MiB that kept its name. The faint bar is the 640 MiB genuinely allocated and genuinely charged. A directory walk — which is exactly what du sees — accounts for a fifth of it; the /proc sweep recovers the rest and names the process holding it.
The mechanism is a sweep of /proc, and its two limits are reported rather than papered over. Only
your own processes are readable: another user’s /proc/<pid>/fd is denied to an unprivileged caller,
so in the shared-group-quota case that motivates the feature you can prove a gap exists but cannot
name the colleague holding it. The scan above could read 34 of 1,451 processes, 2.3%, and says so.
And only this node is visible: a descriptor held by a job on a compute node is invisible from a
login node. A scan reporting “1 of 1 processes” from inside a container would be a 100%-coverage
sentence produced from a namespace holding one process, so that case is detected and labelled too.
What is big, and what is big and finished with
For a full quota, “what is the largest directory?” is usually the wrong question — the largest directory is generally the one being worked on. The actionable question is what is large and no longer in use, and the modification time needed to answer it is already read for every file to drive the settling check.
BY AGE
  last modified, regular files
  < 7d     224.0 MiB  ████████████   99.8%       6,000 files
  7-30d          0 B  ░░░░░░░░░░░░    0.0%           0 files
  30-90d         0 B  ░░░░░░░░░░░░    0.0%           0 files
  90d-1y         0 B  ░░░░░░░░░░░░    0.0%           0 files
  > 1y           0 B  ░░░░░░░░░░░░    0.0%           0 files
Alongside it, rapiDU recognises directories that are caches rather than data — Conda and pip package
caches, Hugging Face and PyTorch model caches, container image caches, node_modules, __pycache__,
Git object stores, abandoned experiment logs — and prints each with its measured size, its inode
count, and the command that reclaims it. They are grouped by kind rather than listed per
directory, because a home directory with twenty-five Git repositories otherwise produces twenty-five
identical git gc lines that bury the one large model cache which was the actual answer.
It deletes nothing, and there is no flag that makes it. That is a design decision rather than caution: the tool’s authority comes from being a measurement instrument, and an instrument that also removes things is one nobody is willing to run on a full filesystem at two in the morning. Printing the command is strictly more useful than running it, because the reader can read it first.
Reconciliation, and refusing to conclude
With a walk, a /proc sweep and a quota reading in hand, the tool can attempt the arithmetic a
storage question ultimately comes down to:
walk total + unlinked-but-open ≈ quota used # and when it does not, say soThe interesting engineering is in when not to report a result. The quota term is a snapshot of unknown age, so a difference is not a finding until the possibility that one input is merely old has been ruled out. Every condition that could invalidate the comparison downgrades the verdict and names itself: a snapshot older than five minutes, directories that could not be read, entries that could not be inspected, a walk that crossed more filesystems than the quota governs, an interrupted walk, or a stat-free count being compared against an inode quota it cannot match. The verdicts are reconciles, subtree of a larger quota’d tree, inconclusive — and here is what blocked it, and unexplained gap. Candidate explanations are listed and explicitly labelled as not asserted.
An earlier version of this logic reported an unexplained gap the size of the entire quota after a stat-free walk, because a walk with no byte figures was compared against a live block quota. That is now a named blocker, and a continuous-integration job asserts that a count-only walk can never produce a gap verdict.
Running where nothing is installed
The stdlib-only constraint is enforced rather than intended. One continuous-integration job walks
every module’s abstract syntax tree and fails if a single import lies outside the standard library.
Another runs the tool from a bare PYTHONPATH with nothing installed and no quota command present,
and requires every absent field to read n/a with a stated reason — not zero, and not a
traceback. A third unpacks the built wheel and fails if it declares one unconditional dependency. A
fourth checks that no colour escape sequences leak into redirected output, including from --help,
because rdu --help > usage.txt is exactly what someone does before pasting into a support ticket.
The floor is Python 3.6, verified by hand on the 3.6.8 interpreter of a RHEL 8 login node, with the test suite running on 3.9 through 3.13. The package is about 6,000 lines of typed Python against 4,400 lines of tests — 294 test functions across 12 modules. That proportion is deliberate for the same reason it is deliberate in any instrument: one that is occasionally wrong is worse than none, because its user stops checking it.
For scripts
Plain text is the default because the destination is usually a support ticket. --json emits the
whole document — walk, quota rows with their ages, /proc sweep, reconciliation verdicts — for
tooling. Three exit codes let a scheduled job branch without parsing prose: 0 for nothing
remarkable, 1 for something a human should look at, 2 for an error.
That middle code took a correction worth recording. rdu -Q originally exited 0 on a fileset at
99.9% of its block quota and 92.8% of its inode quota, because the attention code fired only when the
backend was unavailable. The one invocation cheap enough to run from cron reported “fine” in
precisely the two states that mean writes are about to stop. It now also fires on a grace timer
already counting down.
Why rapiDU rather than du
du has been correct since 1971 and is on every machine. The case for replacing it is not that it
computes the wrong number. It is that the number it computes has stopped being the answer to the
question people are asking.
The question changed and the tool did not
du was designed for a local disk owned by the person asking. Three things have changed. Storage is
now shared and quota-enforced, so the ceiling that stops your work is a figure published by the
quota manager, not by a walk. The filesystem is remote and high-latency, so a single-threaded
walker spends nearly all of its time idle. And the trees are enormous — the tree measured for this
article holds 1.7 million files in one user’s directory — so a walk is a multi-minute operation whose
result may be stale by the time it prints.
Against that, du offers one integer and no metadata about it.
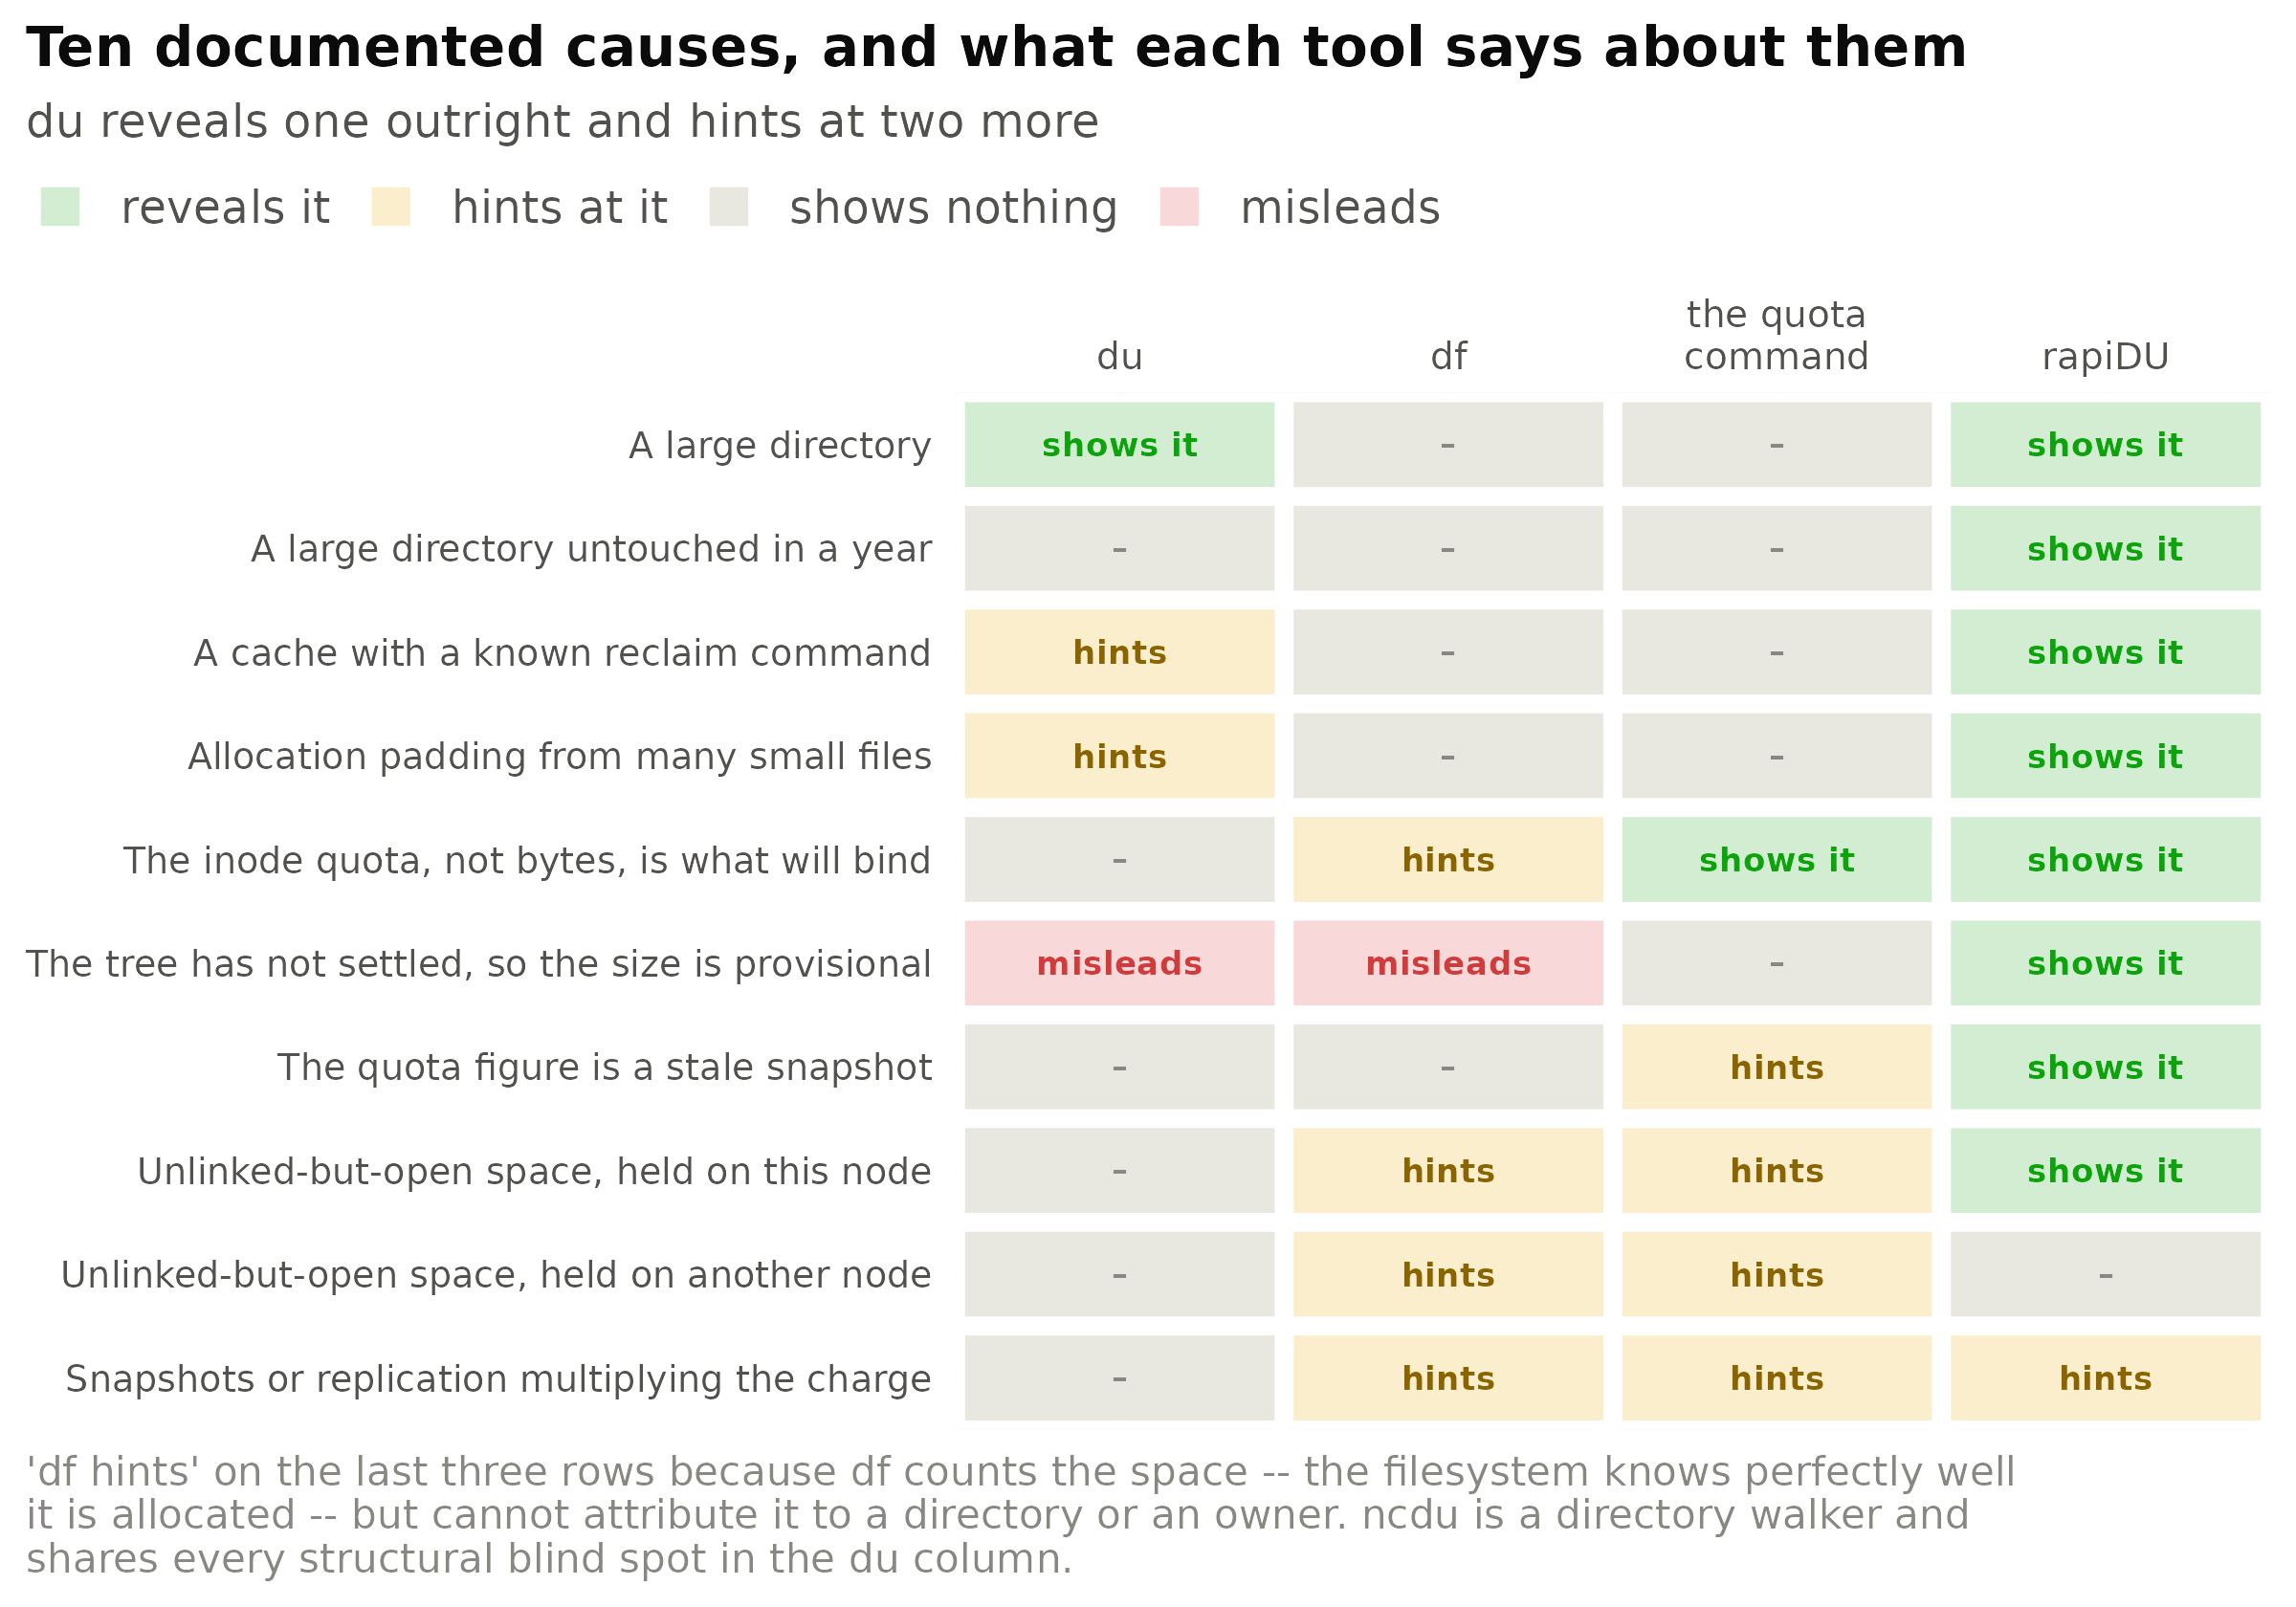
Figure 9: What each standard tool reveals about each documented cause of a full quota. ‘reveals it’ means the tool reports the fact directly; ‘hints at it’ means the raw material is present but the reader must do the work; ‘misleads’ means it prints a confident number that is wrong. Two cells are deliberately unflattering to rapiDU: a descriptor held on another machine is outside a single-node scan by construction, and snapshots and replication are listed as candidate explanations because the tool cannot yet probe for them.
Two cells deserve comment. du is marked misleading on an unsettled tree because it does not merely
omit a caveat: it prints a number measured to be 5.58× low, with nothing to signal that anything is
provisional. And rapiDU is marked shows nothing for a descriptor held on another machine, which is
by construction — the sweep reads one node’s /proc. That is the most expensive class in the ticket
record behind this package, at a median of 267.1 hours to resolve, and it remains undetected.
The costs are not hypothetical
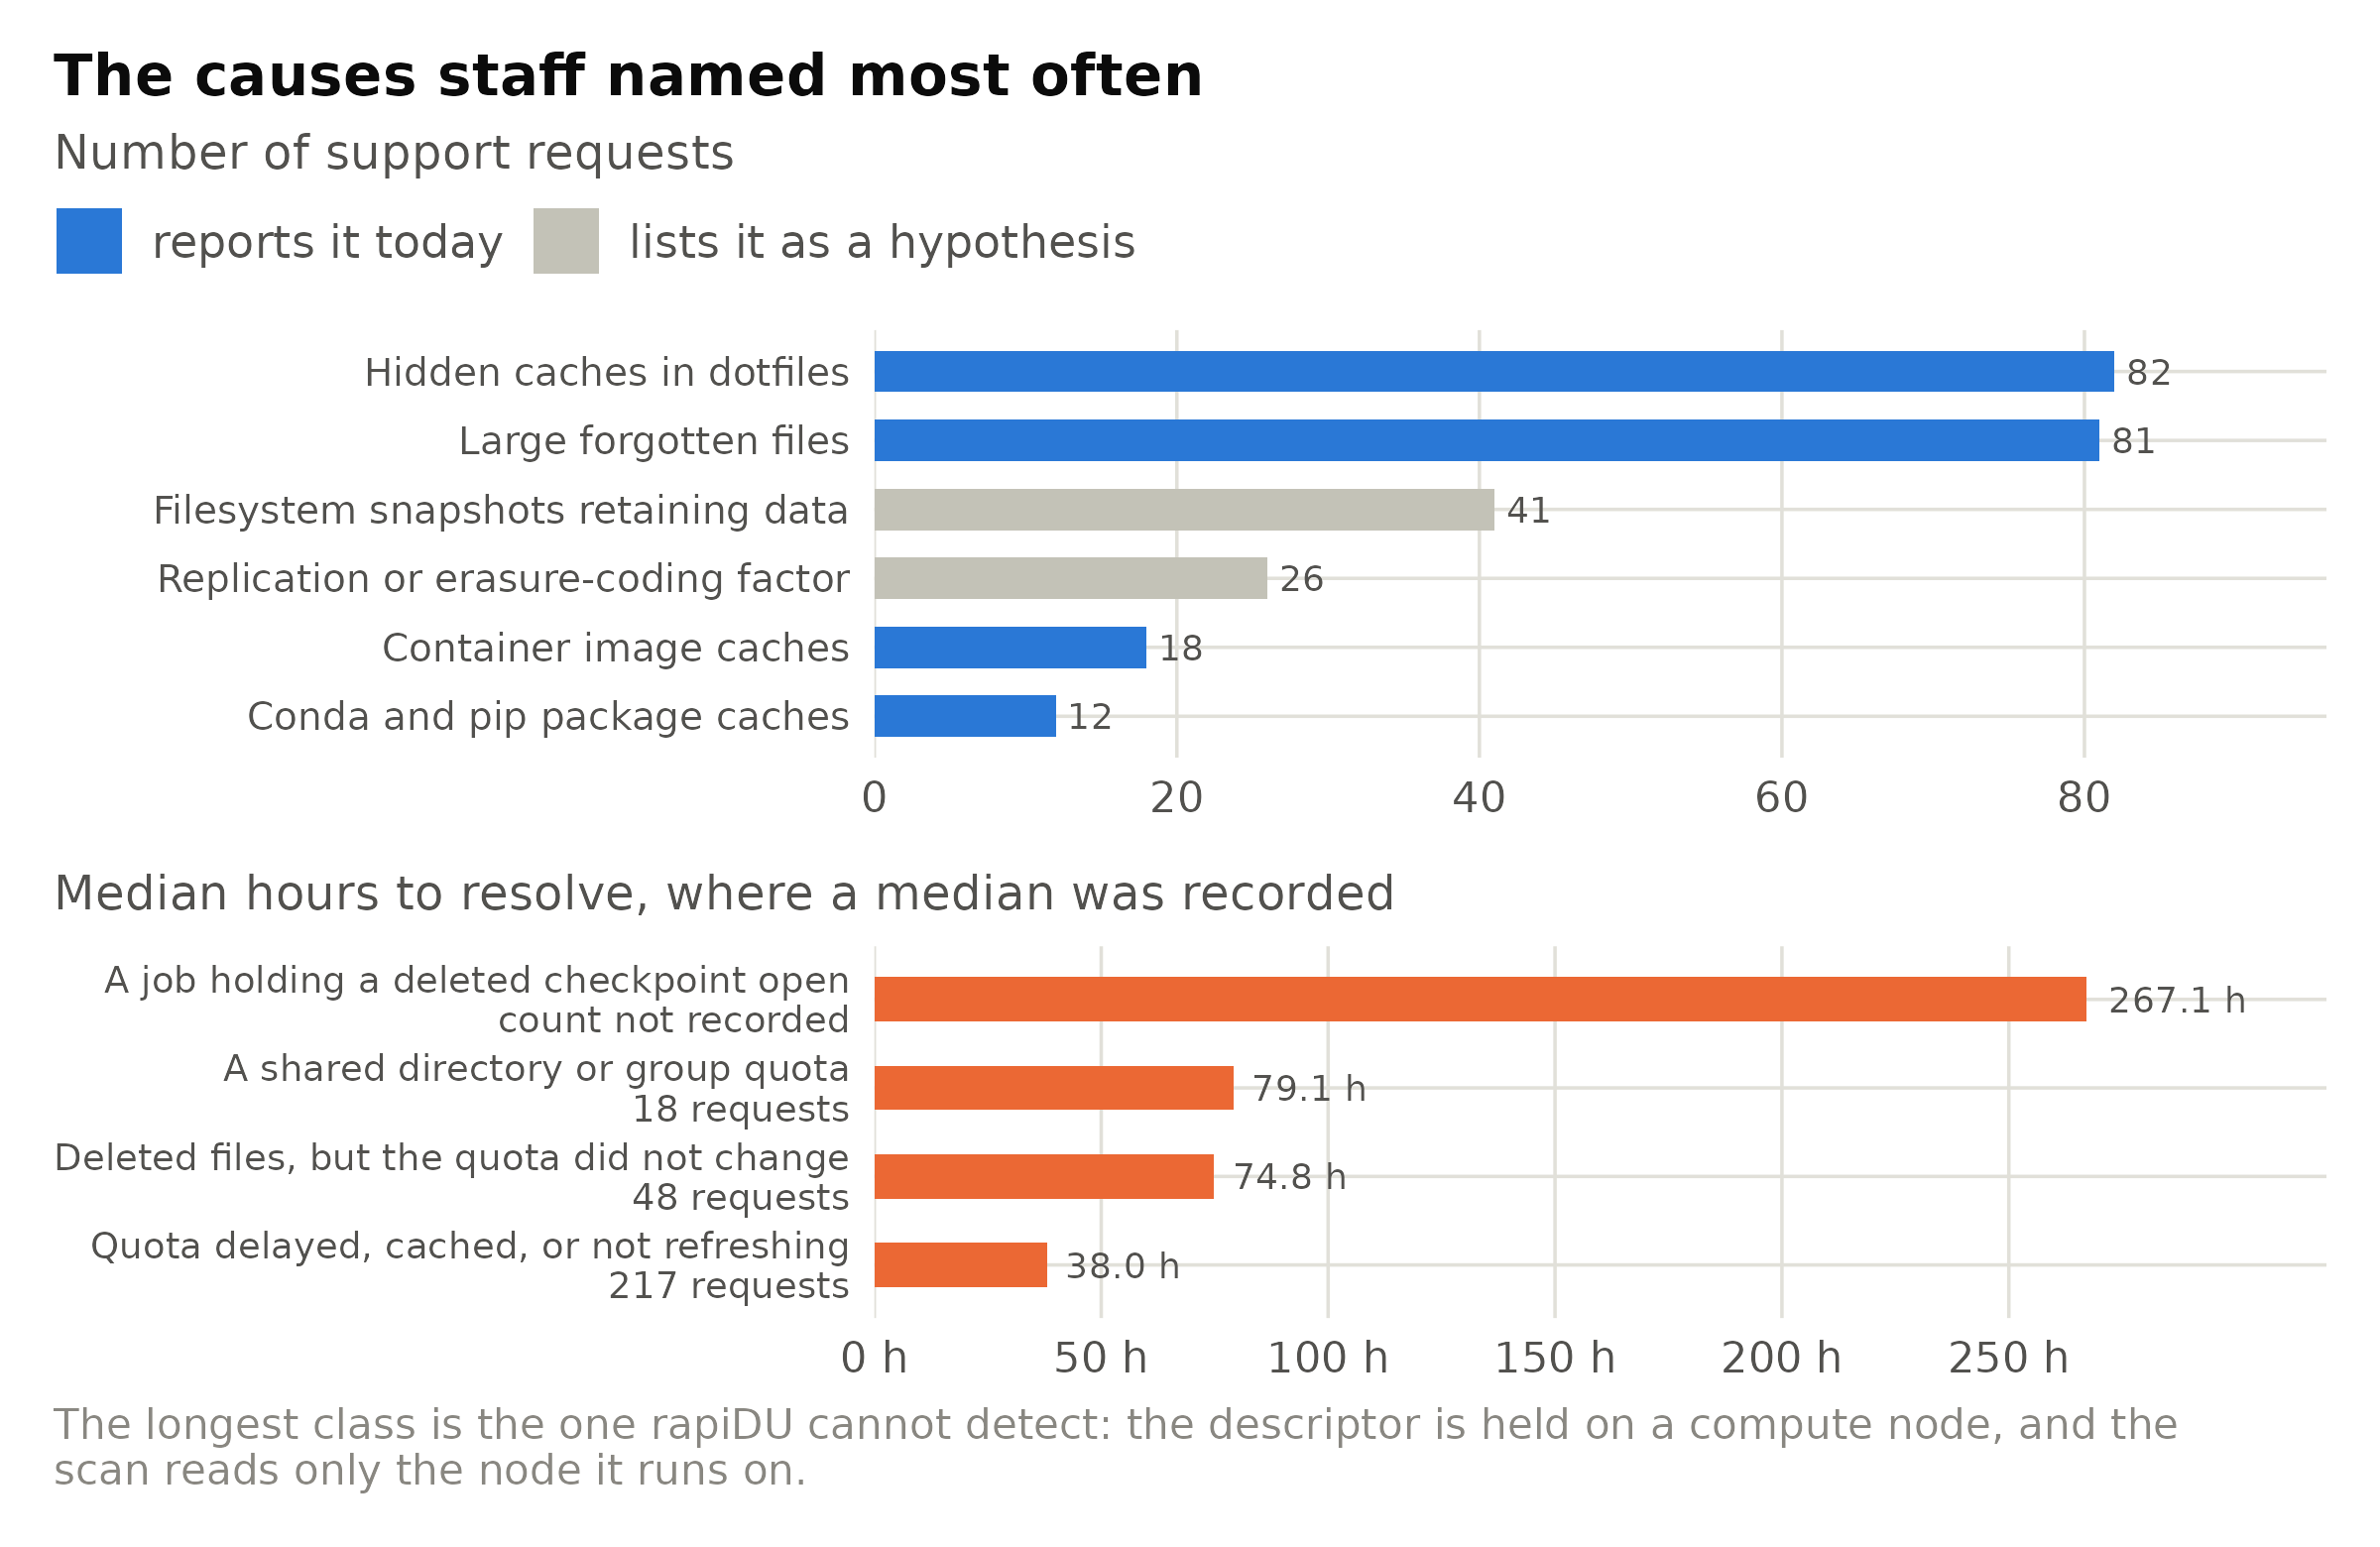
Figure 10: Storage support requests at one HPC centre, as recorded in the design document behind this package. Upper: the six causes staff named most often, coloured by what rapiDU reports today. Lower: the four classes for which a median resolution time was recorded, with the request count where it was recorded. The two largest causes by volume are ordinary hidden caches and forgotten large files – findings that need no cleverness, only a walker that reads modification times and recognises a package cache.
That figure is the argument in miniature. These are not hard problems. They are problems nobody has the instrument for, so they are resolved instead by a member of staff logging in and looking — at a median of one and a half to eleven days per request.
Six advantages, in order of how often they matter
- It reports both ceilings. A block quota and an inode quota are separate limits reached by
different trees.
dureports bytes;rdu -iranks by the count the other limit counts, andrdu -canswers that question several times faster again by skippingstatentirely. - It reports the charge and the gap between the charge and the contents. The padding a tree of
small files pays is recoverable and invisible in either of
du’s two modes taken alone. - It says when its own number is provisional.
duwill hand you a figure that is a factor of five out, silently, and no flag changes this. - It sees space with no directory entry. No walker can; that requires reading
/proc, and the result comes with its coverage attached. - It puts the quota beside the walk with the quota’s age attached — which converts the two most common support requests in the record above from a mystery into a displayed timestamp.
- It has been measured five to seven times faster on a cold walk of a large parallel filesystem, which is the condition under which anyone looks at disk usage in the first place. It is listed last because, as the sweep above shows, it is the one advantage that a given filesystem can decline to deliver.
The ordering is the argument. Speed is what makes rapiDU pleasant when the filesystem permits it; the
first five are what make it a different tool, and none of them is contingent on anything. A du that
ran instantly would still be unable to tell you that the figure it just printed is provisional, that
the quota it appears to contradict was computed a quarter of an hour ago, or that half a gigabyte of
your allocation is held by a file with no name.
Where du is still the right tool
An argument that admits no counter-case is not an argument, and there are three real ones. du is
already installed, everywhere, without exception — which is why rapiDU is stdlib-only and runs
from a bare PYTHONPATH, but it is still one pip install behind. du is specified by POSIX, so
scripts that parse it will keep working for decades; rapiDU is at v0.2.3 and offers a JSON document
rather than a stability guarantee. And on a small tree on a local disk, du finishes before
start-up cost matters and none of the four extra measurements applies: there is no quota, the page
cache makes latency irrelevant, and nothing is unsettled.
So the honest claim is narrower than “replace du”, and it is this. On a quota-enforced parallel
filesystem — where essentially all research computing storage now lives — du answers a question
adjacent to the one being asked, and reports nothing about the confidence of its own answer. That is
the case for reaching for rdu instead, and it happens to be the case in which anybody is looking at
disk usage under pressure.
Three commitments
Measurements, not verdicts. The report presents figures and names what they mean. Where it does offer a judgement it says so and shows the arithmetic. Candidate explanations for a gap are labelled “possible cause (not asserted)”, because a tool that guesses confidently is worse than one that declines.
Absent, with a reason — never zero. Every backend, probe and site fact is optional and degrades to
n/a with a stated cause. Zero is a legitimate value for used space, and a reading that failed must
never be printed as one. The off-site case is a continuous-integration job rather than an
afterthought.
It never deletes anything. There is no --clean, no --purge, and no confirmation prompt that
would justify creating one. The tool prints the command and lets the reader decide.
Availability
rapiDU is open source under the MIT licence.
- Package:
rapiduon PyPI —pip install rapidu. The current release is v0.2.3. The command isrdu, withrapiduas a long alias. - Source: github.com/PursuitOfDataScience/rapidu — including the tests, the continuous-integration jobs that verify the claims above, and the issue tracker.
It is written for Linux and reads GPFS, Lustre and ordinary quota backends where they are present,
degrading to a fast du with a stated reason where they are not; contributions extending the quota
layer to other filesystems are welcome. It began as a tool written during a storage emergency of my
own, when the only available answer to “what is filling this up?” was a du that took five minutes
and then disagreed with the quota for reasons nobody could name.