R packages

Seven packages on CRAN: extensions to ggplot2, tidy tools for text, and data connectors.

packages on CRAN
7
releases
23
downloads from the Posit mirror
47,168

Visualization

ggDoubleHeat

A Heatmap-Like Visualization Tool

A data visualization design that provides comparison between two (Double) data sources (usually on a par with each other) on one reformed heatmap, while inheriting 'ggplot2' features.
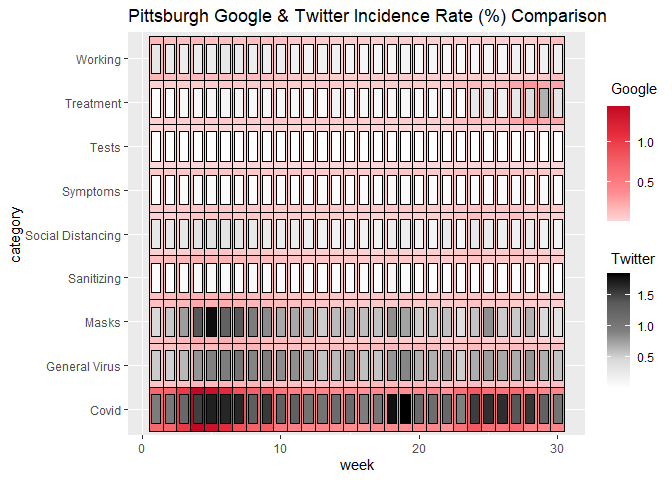
An example plot from the ggDoubleHeat README
install.packages("ggDoubleHeat")
Version
0.1.3
On CRAN since
March 2022
Downloads
18,106
Monthly downloads, last 24 months; the busiest month had 707

ggchangepoint

Combines Changepoint Analysis with 'ggplot2'

A unified, tidy, 'ggplot2'-native interface to changepoint detection in R.

The full description

A unified, tidy, 'ggplot2'-native interface to changepoint detection in R. Provides the 'ggcpt' S3 result class with 'broom'-style tidy/glance/augment methods, 'autoplot()' (with confidence intervals, significance regions, detector statistics, solution paths, scale space, and multivariate facets), composable geoms ('geom_changepoint()', 'geom_cpt_segment()', 'geom_cpt_ci()', 'geom_cpt_region()', 'geom_cpt_label()', 'geom_cpt_event()', 'stat_changepoint()'), and a 'cpt_detect()' dispatcher covering fifty methods with introspection via 'cpt_methods()': penalised/optimal partitioning, multiscale and search methods, nonparametric and kernel methods, Bayesian methods, high-dimensional, functional, covariance and network methods, regression breaks, seasonal-trend decomposition, the classical single-change tests, and robust detection under drift and autocorrelation. Adds inference (Narrowest Significance Pursuit regions, a unified 'cpt_confint()', post-detection tests), selection of the number of changes, influence and sensitivity diagnostics, supervised detection with learned penalties, consensus and method recommendation, event annotation and reproducible reports, benchmarks against the Turing Change Point Dataset, sequential monitoring with detection-delay accounting, power and study design, and an extension mechanism ('as_ggcpt()', 'cpt_register_method()') that brings external and non-CRAN detectors into the same grammar.

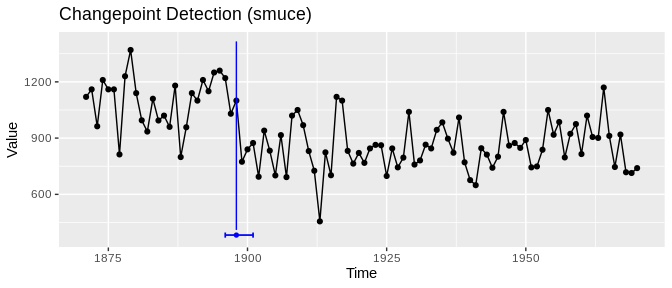
An example plot from the ggchangepoint README
install.packages("ggchangepoint")
Version
0.5.0
On CRAN since
February 2022
Downloads
13,864
Monthly downloads, last 24 months; the busiest month had 572

ggtaichi

Taichi-Diagram Visualization for Two Data Sources

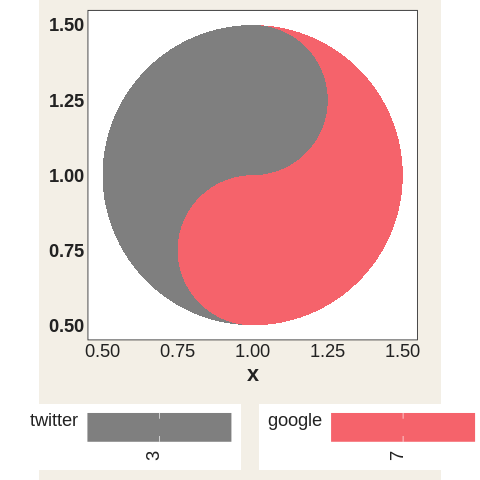
A data visualization design that compares two (usually on a par with each other) data sources on one grid of taichi (yin-yang) diagrams, where the two interlocking fish of every symbol are filled by the two sources, while inheriting 'ggplot2' features.

An example plot from the ggtaichi README
install.packages("ggtaichi")
Version
0.3.0
On CRAN since
June 2026
Downloads
1,035
Monthly downloads, last 24 months; the busiest month had 315

Text

tidyEmoji

Discover, Count, Categorise, Score, Translate and Relate Emoji in Text

A tidy toolkit for working with the emoji in any text column, such as social-media posts, product reviews, chat logs or survey responses.

The full description

A tidy toolkit for working with the emoji in any text column, such as social-media posts, product reviews, chat logs or survey responses. Unicode is awkward to handle and not every code point is an emoji, which makes emoji statistics fiddly to obtain. 'tidyEmoji' extracts, counts, categorises, sentiment-scores and emotion-scores emoji, converts them to and from text (for accessibility and NLP preprocessing), searches the emoji catalogue, maps emoji co-occurrence and sequences (graph-ready edge lists and n-grams), measures where and how densely emoji are used, and builds document-by-emoji feature tables for machine learning, with grapheme-aware detection (so skin-tone and multi-person sequences stay intact), returning tidy data frames that slot straight into a 'tidyverse' workflow. It also quantifies how much annotators disagreed about an emoji (interpretation risk), extracts the words around each emoji, tracks emoji use over time, measures text-emoji sentiment mismatch, and applies explicit emoji-preprocessing policies for language-model pipelines. The bundled emoji sentiment lexicon is from the Emoji Sentiment Ranking of Kralj Novak et al. (2015) <doi:10.1371/journal.pone.0144296>, released under CC BY-SA 4.0; the emotion lexicon is from EmoTag1200 of Shoeb & de Melo (2020) <https://aclanthology.org/2020.emnlp-main.720/>, released under the MIT licence.

install.packages("tidyEmoji")
Version
0.4.0
On CRAN since
February 2022
Downloads
12,111
Monthly downloads, last 24 months; the busiest month had 470

tidycjk

Tidy Tools for Chinese, Japanese and Korean Text

A tidy toolkit for text that is written in Chinese, Japanese or Korean.

The full description

A tidy toolkit for text that is written in Chinese, Japanese or Korean. Most text tooling in R assumes that words are separated by whitespace, which CJK writing does not use, so ordinary summaries of a text column either treat a sentence as one undifferentiated blob or split it into isolated characters. Word segmentation is therefore a pluggable engine that the caller names explicitly rather than a bundled dictionary, because where a word ends is a fact about a language and not about Unicode. 'tidycjk' classifies characters by Unicode block, reports which script and which language a text is written in, measures how much of a text is CJK, and turns those measurements into tibbles that slot straight into a 'tidyverse' workflow. It also measures display width in terminal columns, pads and truncates to a width rather than to a character count, and normalises fullwidth and halfwidth forms surgically -- including composing halfwidth katakana voiced marks into single code points -- without the collateral damage of a full 'NFKC' pass. Language detection deliberately returns NA rather than guessing when a text is written in Han characters only, because Japanese written without kana cannot be distinguished from Chinese by script alone. Everything is derived from the Unicode specification; the package makes no network requests and needs no compiled code of its own.

install.packages("tidycjk")
Version
0.1.0
On CRAN since
September 2026
Downloads
303
Monthly downloads, last 24 months; the busiest month had 246

Data

countryatlas

Join World Bank Data, Country Codes and Maps on the ISO Spine

A complete toolkit for getting country data onto honest maps.

The full description

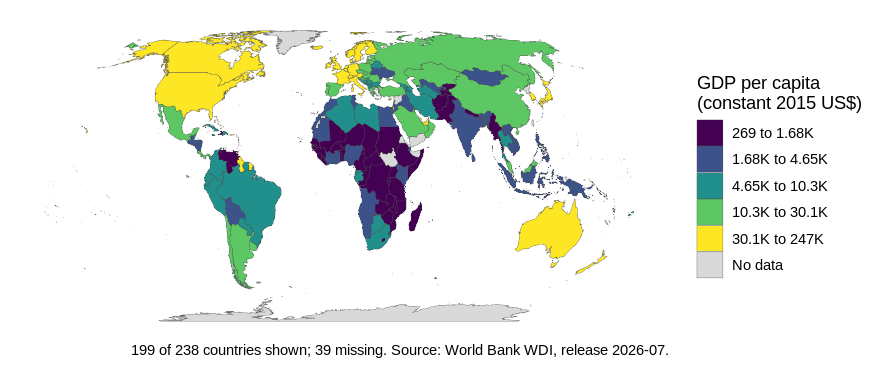
A complete toolkit for getting country data onto honest maps. Country names rarely line up across data sources ("US", "U.S.", "United States", "United States of America" are one country, but a naive join treats them as four), so 'countryatlas' makes ISO codes the universal join key. It generalises a one-call, map-ready table that stitches together 'ggplot2' map geometry, 'WDI' World Bank indicators and the 'countrycode' Rosetta stone; exposes the join machinery for the user's own data; ships curated reference data (metadata, group memberships, an indicator catalogue, flags and currencies); adds analysis helpers (per-capita, regional roll-ups, ranking, inequality and convergence statistics); and turns one hand-drawn choropleth into a full vocabulary of projected, area-honest maps (binned and quantile choropleths, proportional-symbol, spike, bivariate, value-by-alpha, cartogram, tile-grid, flow, small-multiple, animated, globe and interactive), and can hand its curated, ISO-reconciled tables to 'ggsql' for database-side spatial rendering. Honesty is treated as a feature rather than a slogan: classification methods can be compared side by side, missing data can be hatched rather than greyed, coverage and provenance travel with the plot, and the distortion each projection introduces can be measured and drawn. Heavy spatial dependencies stay optional, and a bundled offline snapshot lets every example, test and vignette run without the network.

An example plot from the countryatlas README
install.packages("countryatlas")
Version
3.0.0
On CRAN since
June 2026
Downloads
1,326
Monthly downloads, last 24 months; the busiest month had 370

icebergr

Read and Write 'Apache Iceberg' Tables

A native client for 'Apache Iceberg', the open table format used by 'Snowflake', 'Databricks', 'BigQuery', 'AWS' and 'Dremio'.

The full description

A native client for 'Apache Iceberg', the open table format used by 'Snowflake', 'Databricks', 'BigQuery', 'AWS' and 'Dremio'. R has otherwise been able to read 'Iceberg' tables only by routing through 'DuckDB' as an intermediary, which rules out writes, snapshot management and catalog integration. This package talks to 'Iceberg' directly: it connects to REST and 'AWS Glue' catalogs, lists namespaces and tables, reads the schema and partition specification of a table, scans data with predicates and projections pushed down, travels back through snapshot history, and appends new data. 'Apache Arrow' is the interchange layer throughout, so scan results arrive in R without a serialisation round trip. Built on 'iceberg-rust', the Apache-governed 'Rust' implementation, via 'extendr'. Supports table spec versions 1 and 2; see the 'README' for the full matrix of supported and unsupported features. This is a community package, not affiliated with or endorsed by The Apache Software Foundation; 'Apache', 'Apache Iceberg' and 'Iceberg' are trademarks of The Apache Software Foundation.

install.packages("icebergr")
Version
0.1.0
On CRAN since
September 2026
Downloads
423
Monthly downloads, last 24 months; the busiest month had 338

Every release, on one calendar

Figures as of October 8, 2026: versions and publication dates from CRAN, downloads from the Posit CRAN mirror via cranlogs.