Correcting Claude Code's Cluster Resource Requests with slurmwatch: Requested Memory and CPU Cores Against Actual Usage
Contents 15 sections
- The numbers this article compares
- What slurmwatch is, and why the request needs it
- Where the evidence comes from
- How much of each request was used
- Why memory goes wrong more than cores
- Why the easily available memory numbers made it worse
- What slurmwatch showed on the jobs it measured
- Instruction first, then instrumentation
- The corrections, one at a time
- Where the correction did not carry over
- A request that was correct when it was written
- The costliest version of the same mistake
- Why an instrument and not a better prompt
- Limitations
- Summary
Every job submitted to an HPC cluster begins with a guess. The submission script names how much memory the job may use and how many CPU cores it may occupy; Slurm, the scheduler that hands out the cluster’s machines, reserves exactly that and runs the job. If the guess was far too large, nothing goes wrong. The job finishes, writes its output, reports success, and the memory it reserved but never touched was quietly unavailable to everybody else the whole time.
Claude Code makes those guesses plausibly enough that nobody checks them. It writes correct submission scripts, chains dependent jobs, and diagnoses a failed run from its log. The resource request is the one part it gets consistently and substantially wrong, and it has no way of finding out.
This article measures how wrong, using every job Claude Code submitted on a university cluster during a sustained stretch of machine-learning and data-processing work. The short version is that the typical job used about an eighth of the memory it reserved and half the cores. It then shows what fixed that, which was not a better prompt but an instrument: slurmwatch, a tool that reads a running job’s real usage off the compute node.
The numbers this article compares
Everything below is one comparison, applied to two resources and, more briefly, to a third. It is worth stating in plain terms before any chart appears.
Memory. The request is the --mem line in the submission script: --mem=96G reserves 96 gibibytes.
The usage is the highest the job’s memory actually reached at any moment while it ran. If a job asks for
96 and peaks at 6, it held 90 gibibytes that nothing used.
CPU cores. The request is --cpus-per-task: --cpus-per-task=8 reserves eight cores. The usage is
how many of those cores were genuinely busy. A single-threaded program given eight cores uses one and
leaves seven idle. This figure is often fractional, and that is not an error: 0.4 cores means the job
kept one core busy about forty per cent of the time.
The time limit, thirdly and less importantly. The request is --time, and the usage is how much of
it the job needed. Over-requesting time does not hold capacity away from anybody, so it costs far less
than the other two, but it is measured here because it comes from the same habit.
Both are reported here as a percentage (“this job used 13 % of the memory it requested”) or as a multiple (“this job was given 8 times the cores it used”). Those are the same fact in two directions.
What slurmwatch is, and why the request needs it
The awkward part of the comparison is the second number. The request is written down in the script and trivially available. The usage happens on a compute node, hundreds of metres away, that you never log into, and the only thing that normally comes back is whatever the program chose to print.
slurmwatch exists to close that gap. It is a small open-source
command-line tool: sw 12345, or sw with no arguments to let it find your running job, and it
displays live in the terminal what that job is doing to the hardware it was given. A companion article,
slurmwatch: Live Telemetry for HPC Jobs,
introduces the tool properly and describes its design. This article is the follow-up that measures
something with it, and it takes only the parts it needs.
What it needs is four numbers, which slurmwatch --once --json <jobid> prints in two seconds and which
a script or an agent can read directly:
- how many cores were actually busy, which is what
--cpus-per-taskshould be sized against; - how much memory the job genuinely needs, which is not the same as either of the two memory numbers that are easier to obtain, for the reason a later section gives;
- how full the GPU’s memory is and how busy the GPU is, for jobs that use one.
The rest of this article is what those numbers revealed.
Where the evidence comes from
Claude Code keeps a structured transcript of every session, which preserves the scripts it wrote and every correction its user typed. Slurm’s accounting database independently retains what each job requested and what it recorded. Together these cover 761 submissions. One submission can be an array job, which launches many near-identical tasks at once, so counting task by task gives 5,292 jobs. Excluding 342 synthetic jobs written to exercise a monitoring tool leaves 4,950, and keeping only jobs that ran at least two minutes, so that usage figures mean anything, leaves 3,483 jobs of 323 different kinds. Every figure below that covers all the jobs is drawn from that set.
For 21 jobs a slurmwatch snapshot was taken while the job was running. Those 21 are the only jobs here with a trustworthy memory measurement, for a reason the article gets to shortly.
One point about the model, because the obvious reading of everything below is that a cheaper tier was used and the results say nothing about a capable one. Every job in this record was written by Opus 5 — the strongest model available — running at maximum reasoning effort throughout. No smaller or faster tier appears anywhere in the sample. The over-request is therefore not a symptom of an underpowered model, and that is the whole point: the gap survives the best reasoning available because it is not a reasoning failure. The number the request needs is on a compute node the model cannot see.
Job names, script names and project names are omitted throughout; workloads are described by what they did.
How much of each request was used
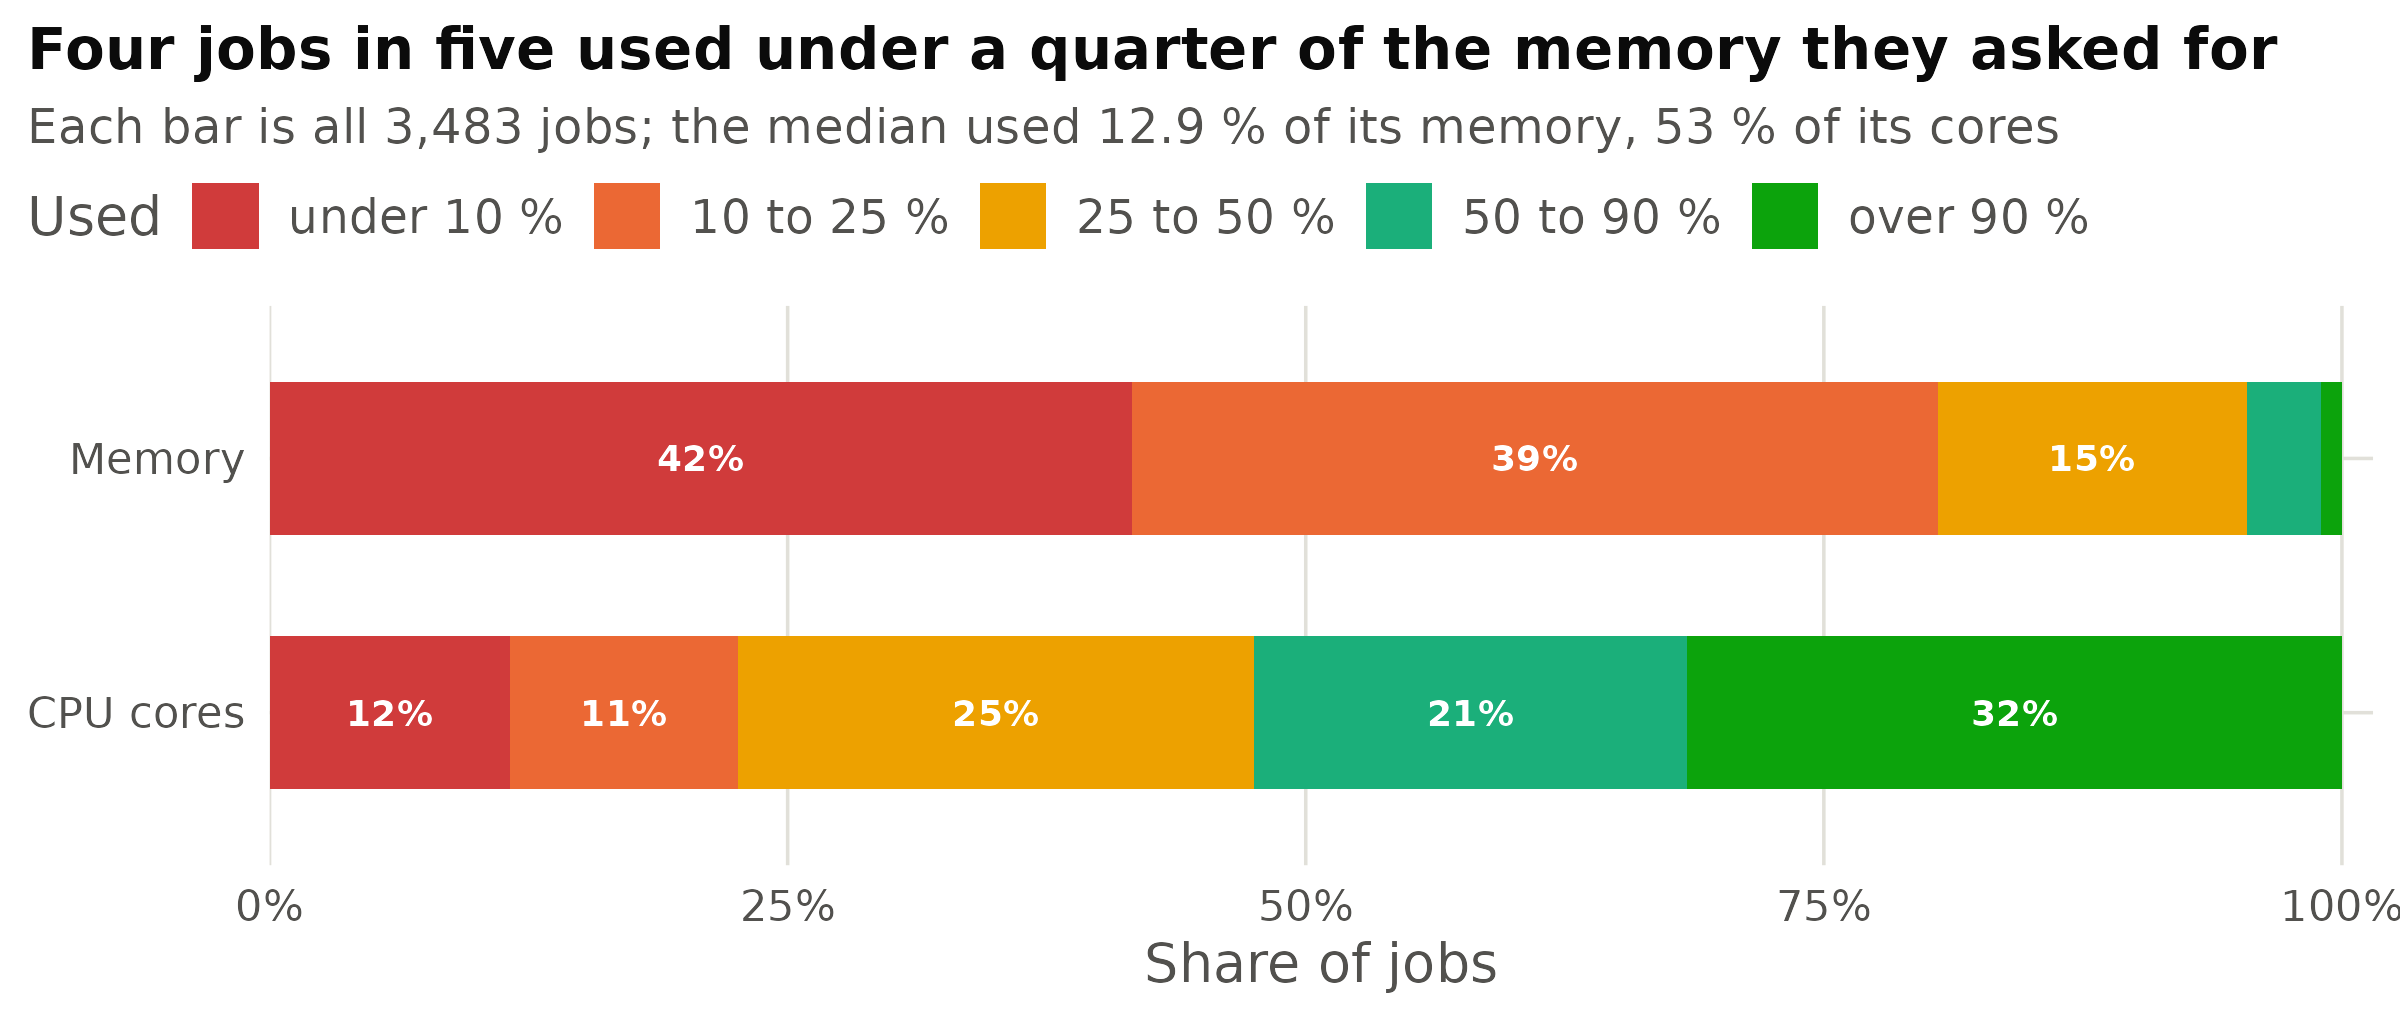
Figure 1: Jobs that ran at least two minutes, excluding synthetic test jobs written to exercise a monitoring tool. A long time limit is much cheaper to get wrong than a large memory request, so the bottom bar should be read as the same habit rather than the same cost.
The green block on the CPU bar is worth reading carefully, because it is not luck. Almost all of it is small single-core tasks that asked for one core and kept it busy, which is the request being made correctly. The red and orange at the other end of the same bar are the memory error on a smaller scale: four, six or eight cores requested for work that used one.
The time limit is the loosest of the three and the least worth worrying about. Nearly three jobs in five finished inside a tenth of the time they had asked for. A generous limit mostly costs queue position, because a shorter request can slip into gaps in the schedule that a long one cannot, and on a chain of jobs that resume each other a long limit is deliberate. Five jobs in the whole record were killed for running past their limit, against twelve killed for running out of memory.
Over the whole period this adds up to 25,888 gibibyte-hours of memory reserved against a peak demand of 10,696, and 3,473 core-hours reserved against 963 consumed. A gibibyte-hour is one gibibyte held for one hour, so those are totals of reserved capacity over time rather than counts of jobs. Both understate the problem, for the reason the next two sections give.
Why memory goes wrong more than cores
The two resources punish a bad guess very differently, and that difference is why the two bars in Figure 1 look nothing like each other.
A job given too few cores runs slowly and finishes. A job given too little memory is killed, and it is killed late: the run looks healthy for an hour, then its memory spikes once and the scheduler destroys it. Over the period, 12 of the 4,950 jobs died that way, 0.24 %. In four of the twelve the recorded peak was at or above ninety per cent of the request, so the request had simply been cut too fine. In the other eight it shows a peak inside the limit, or no peak at all, meaning the fatal spike happened between two samples and was never recorded.
So the incentives are asymmetric. Asking for too little memory destroys hours of work; asking for too much costs nothing anyone will ever mention. Any process optimising against what it can observe will over-request, and it is locally right to.
Why the easily available memory numbers made it worse
This is the part I did not expect, and it is the reason a dedicated instrument matters rather than merely being convenient.
Before slurmwatch there were two ways to find out how much memory a job had used, and both of them report a number larger than the truth.
- Slurm’s accounting reports
MaxRSS, the largest memory footprint it sampled. When a job has several processes this adds up pages that the processes share, counting the same physical memory once per process. - Linux itself keeps a counter of the highest memory the job ever held. That is closer to authoritative, but it includes the file cache: copies of files the operating system is holding on the job’s behalf, which it would hand back instantly if anything else wanted them.
Neither is the number that decides whether a job survives. That number is what the job genuinely needs, and it is smaller than both. slurmwatch reports it by subtracting the file cache; the other two do not.
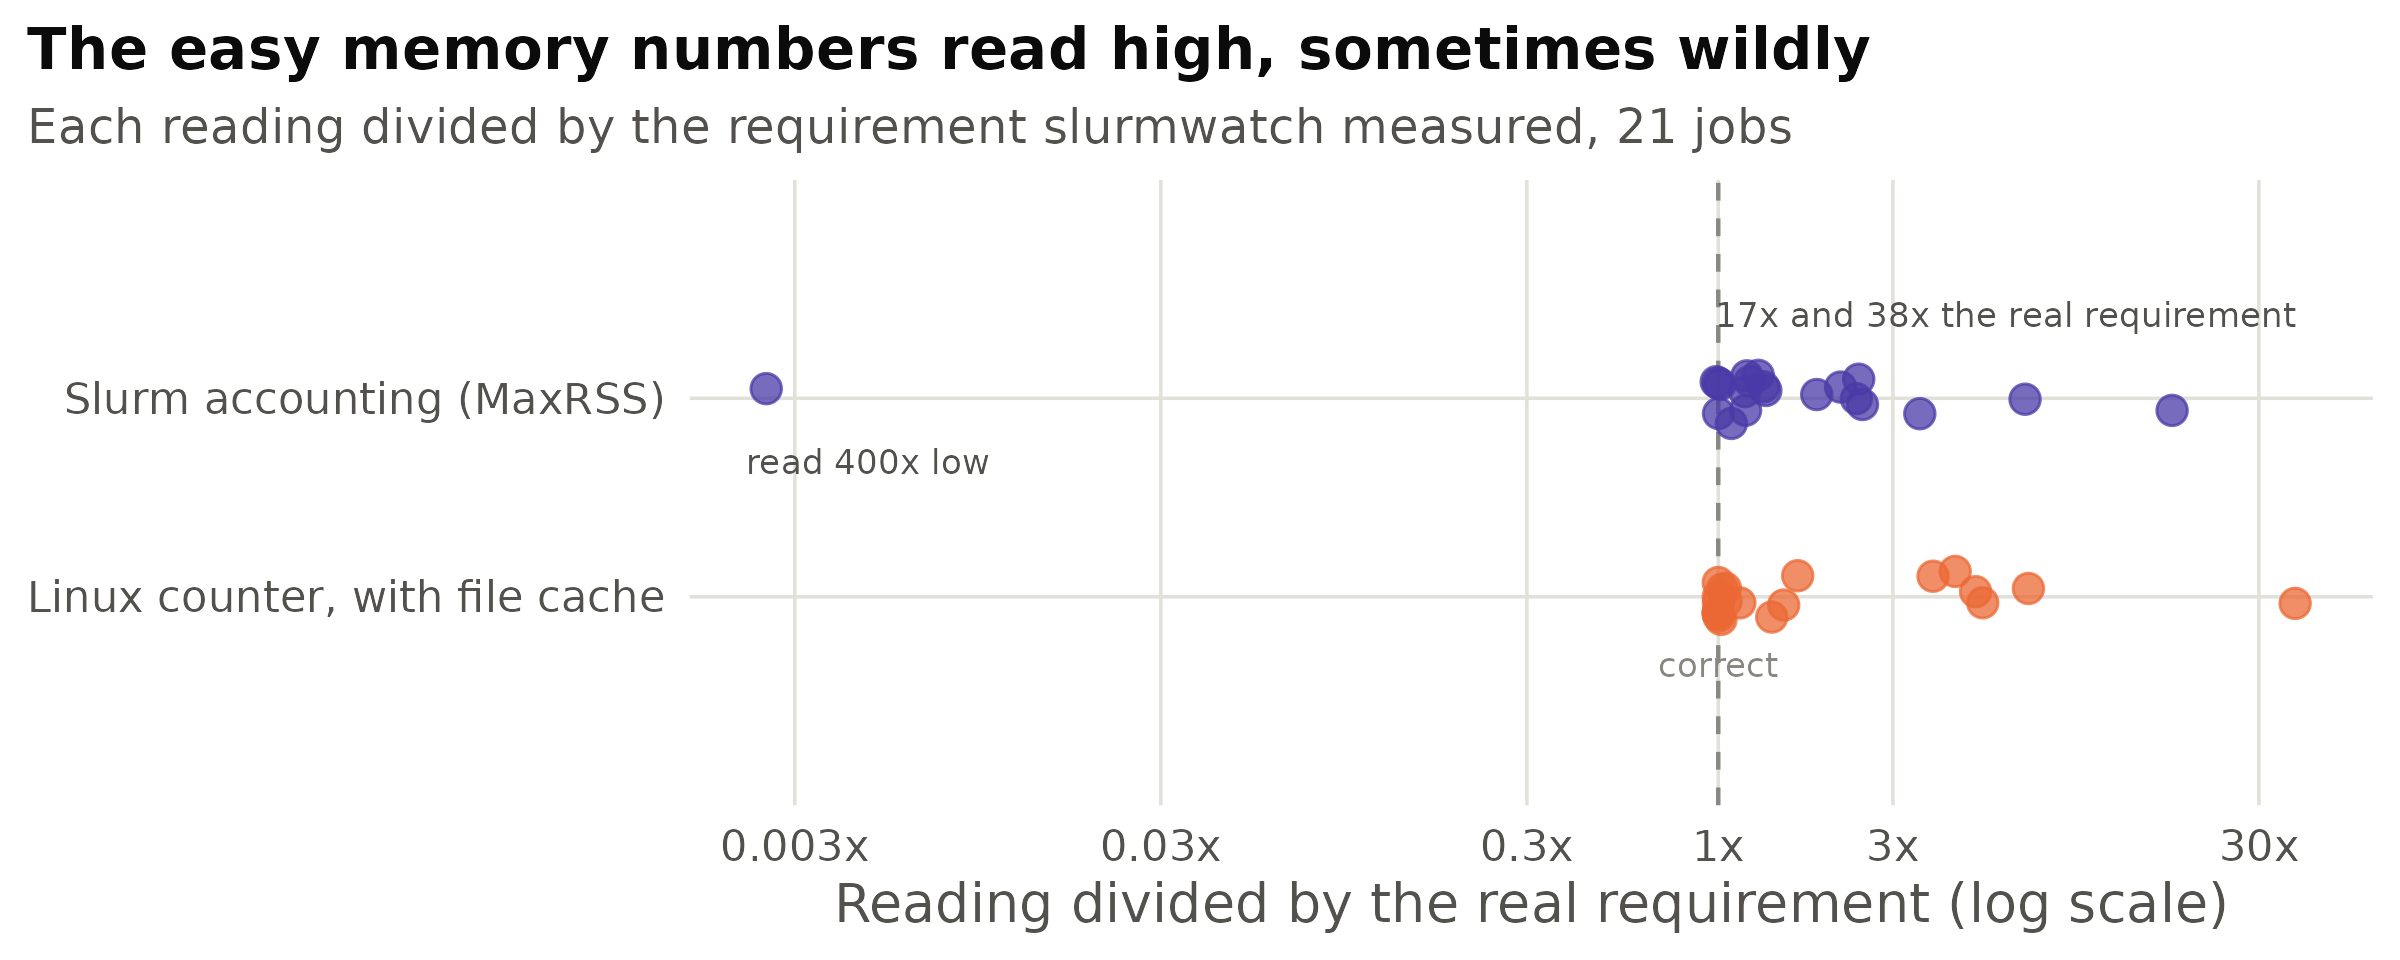
Figure 2: The worst case in absolute terms: a job that genuinely needed 0.40 GiB was reported as 6.95 GiB by Slurm’s accounting and 15.07 GiB by the Linux counter, the second of those above the job’s own 8 GiB limit.
The consequence is the one that matters. Claude Code was not refusing to measure. On several occasions it did measure, with the instruments it had, and sized the request to 1.4 times a figure that was itself several times too large. Sizing carefully to 1.4 times a number that is 17 times too big reserves twenty-four times what the job needs, while following the instruction exactly. No amount of firmer instruction fixes that. Only a different instrument does.
The converse is in the record too, and it is the clearest evidence that the distinction between these numbers is the operative one. A checkpoint-merging step reported a memory footprint of 42.15 GiB while running perfectly well under a 32 GiB limit. The right conclusion is not “raise the limit” but “about 23 GiB of that is a memory-mapped file the kernel will hand back on demand.” The limit stayed at 32 GiB and the job kept working. That judgement is only available to something that can see the two numbers apart.
What slurmwatch showed on the jobs it measured
One line in three of the figures that follow needs explaining first. The dashed marker is the target this project actually worked to: a request of about 1.4 times the measured peak. That is looser than it sounds, and deliberately so. A job running at 1.4 times its peak is using about seventy per cent of what it holds, and the spare thirty exists because a reading taken once cannot see a spike that has not happened yet.
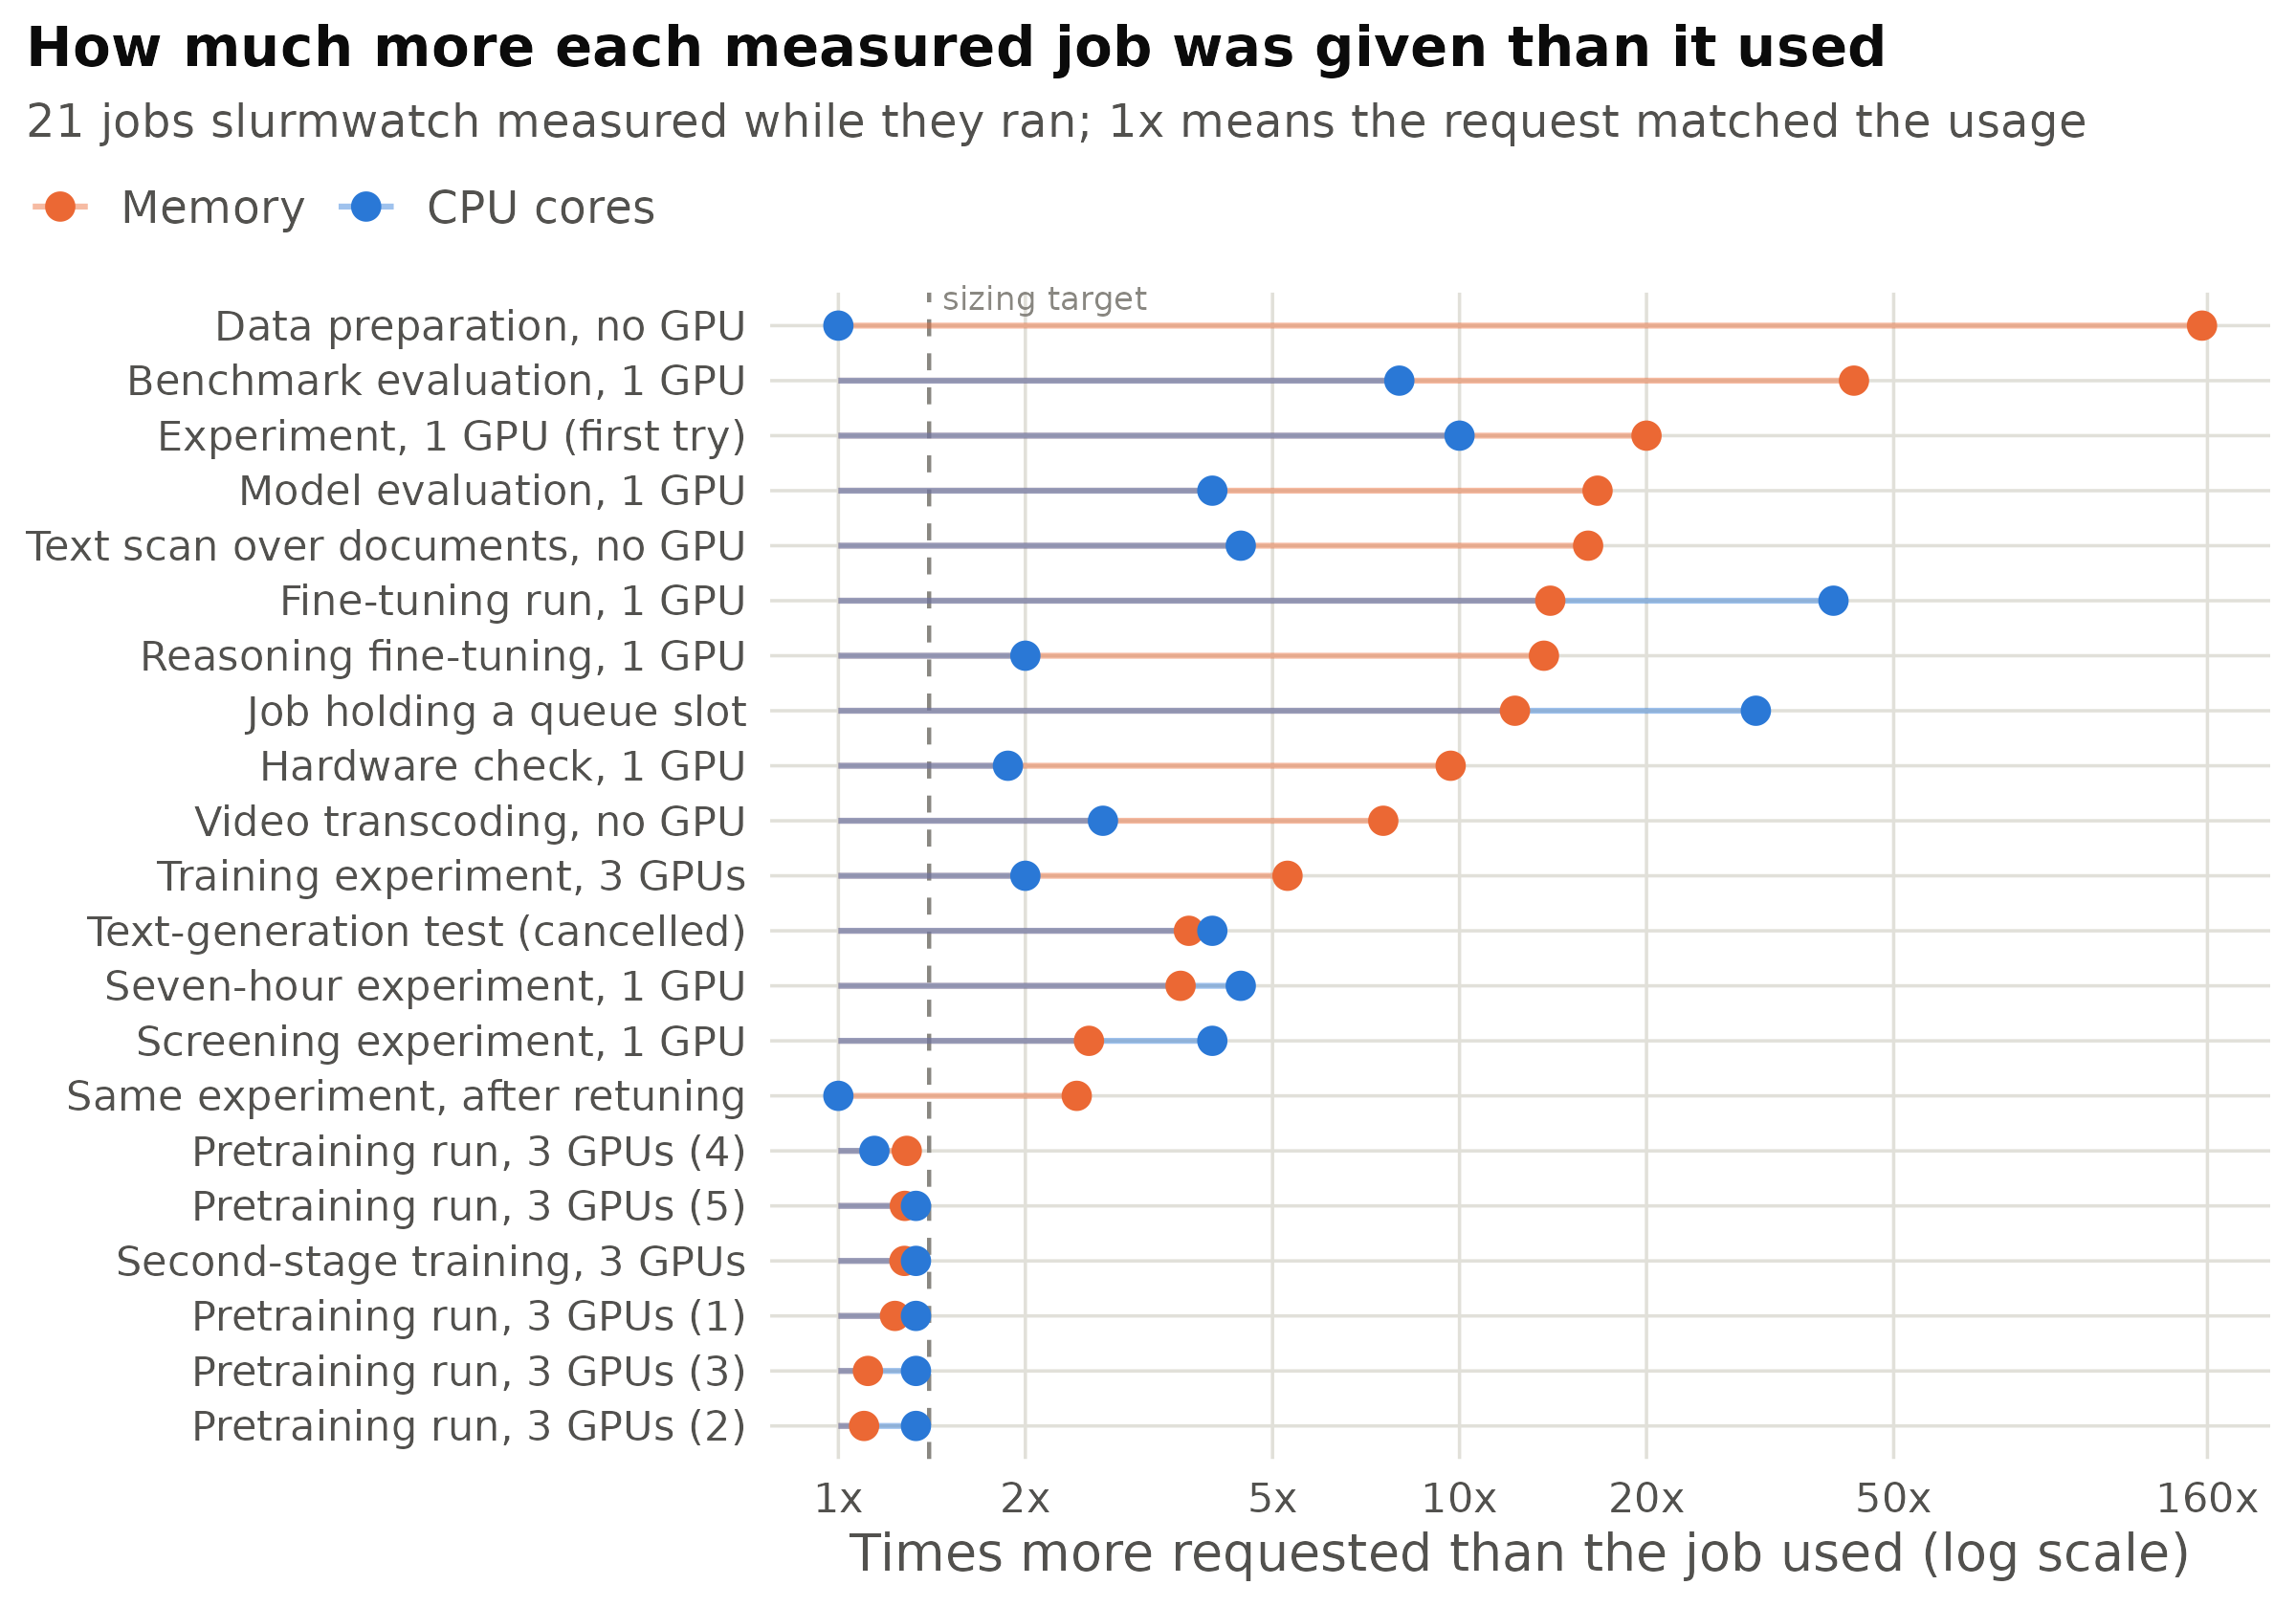
Figure 3: Behind the top row, 7.84 GiB was reserved for a job that needed 0.05. The six rows that reach the memory target are all three-GPU training runs from one pipeline, the only request here that had been cut to fit a measurement.
The clearest single case is the video-transcoding row. That job asked for sixteen cores and six gibibytes. A slurmwatch reading taken 38 seconds into the run showed 6.0 cores busy and a memory peak of 857 megabytes: 38 % of the cores and 14 % of the memory. It was cancelled and resubmitted with eight cores and two gibibytes. The second reading showed 5.0 cores busy of the eight, and a memory peak of 0.61 gibibytes of the 1.96 it now held: 63 % of the cores and 31 % of the memory. The encoder had never been capable of using sixteen cores; it saturates at five or six however many it is given. No amount of reading the code would have produced that number, and the whole exchange cost about a minute of lost encoding. The same array had also been placed on GPU nodes despite needing no GPU, which is a placement error rather than a sizing one, and was caught by looking at where the jobs had landed rather than by any reading of them.
Instruction first, then instrumentation
Two things were introduced during the period, six days apart, and the order is the argument of this article.
The first was a written rule, placed in the configuration file every session reads: size every request
so that actual usage approaches ninety per cent of it, and never round the number up for comfort. The
1.4-times-the-peak marker in the figures is that same rule restated for a single reading. It was
written on the second day of complaints, and by that evening, after two more had arrived, it had
acquired a blunt sentence that is still there. Memory is “the one I keep over-requesting; STOP defaulting to
32/48/96G to be safe.” At that stage the rule named MaxRSS as the way to measure, which is to say it
named one of the two numbers that read high.
The second changed the instrument. A slurmwatch reading became mandatory for every job, the four numbers to read were named, and the older measurement was explicitly superseded. The operative sentence is “take a telemetry snapshot and right-size from the real numbers (don’t guess, don’t pad)”, followed by an instruction to cancel the job and resubmit it if the reading disagrees with the request.
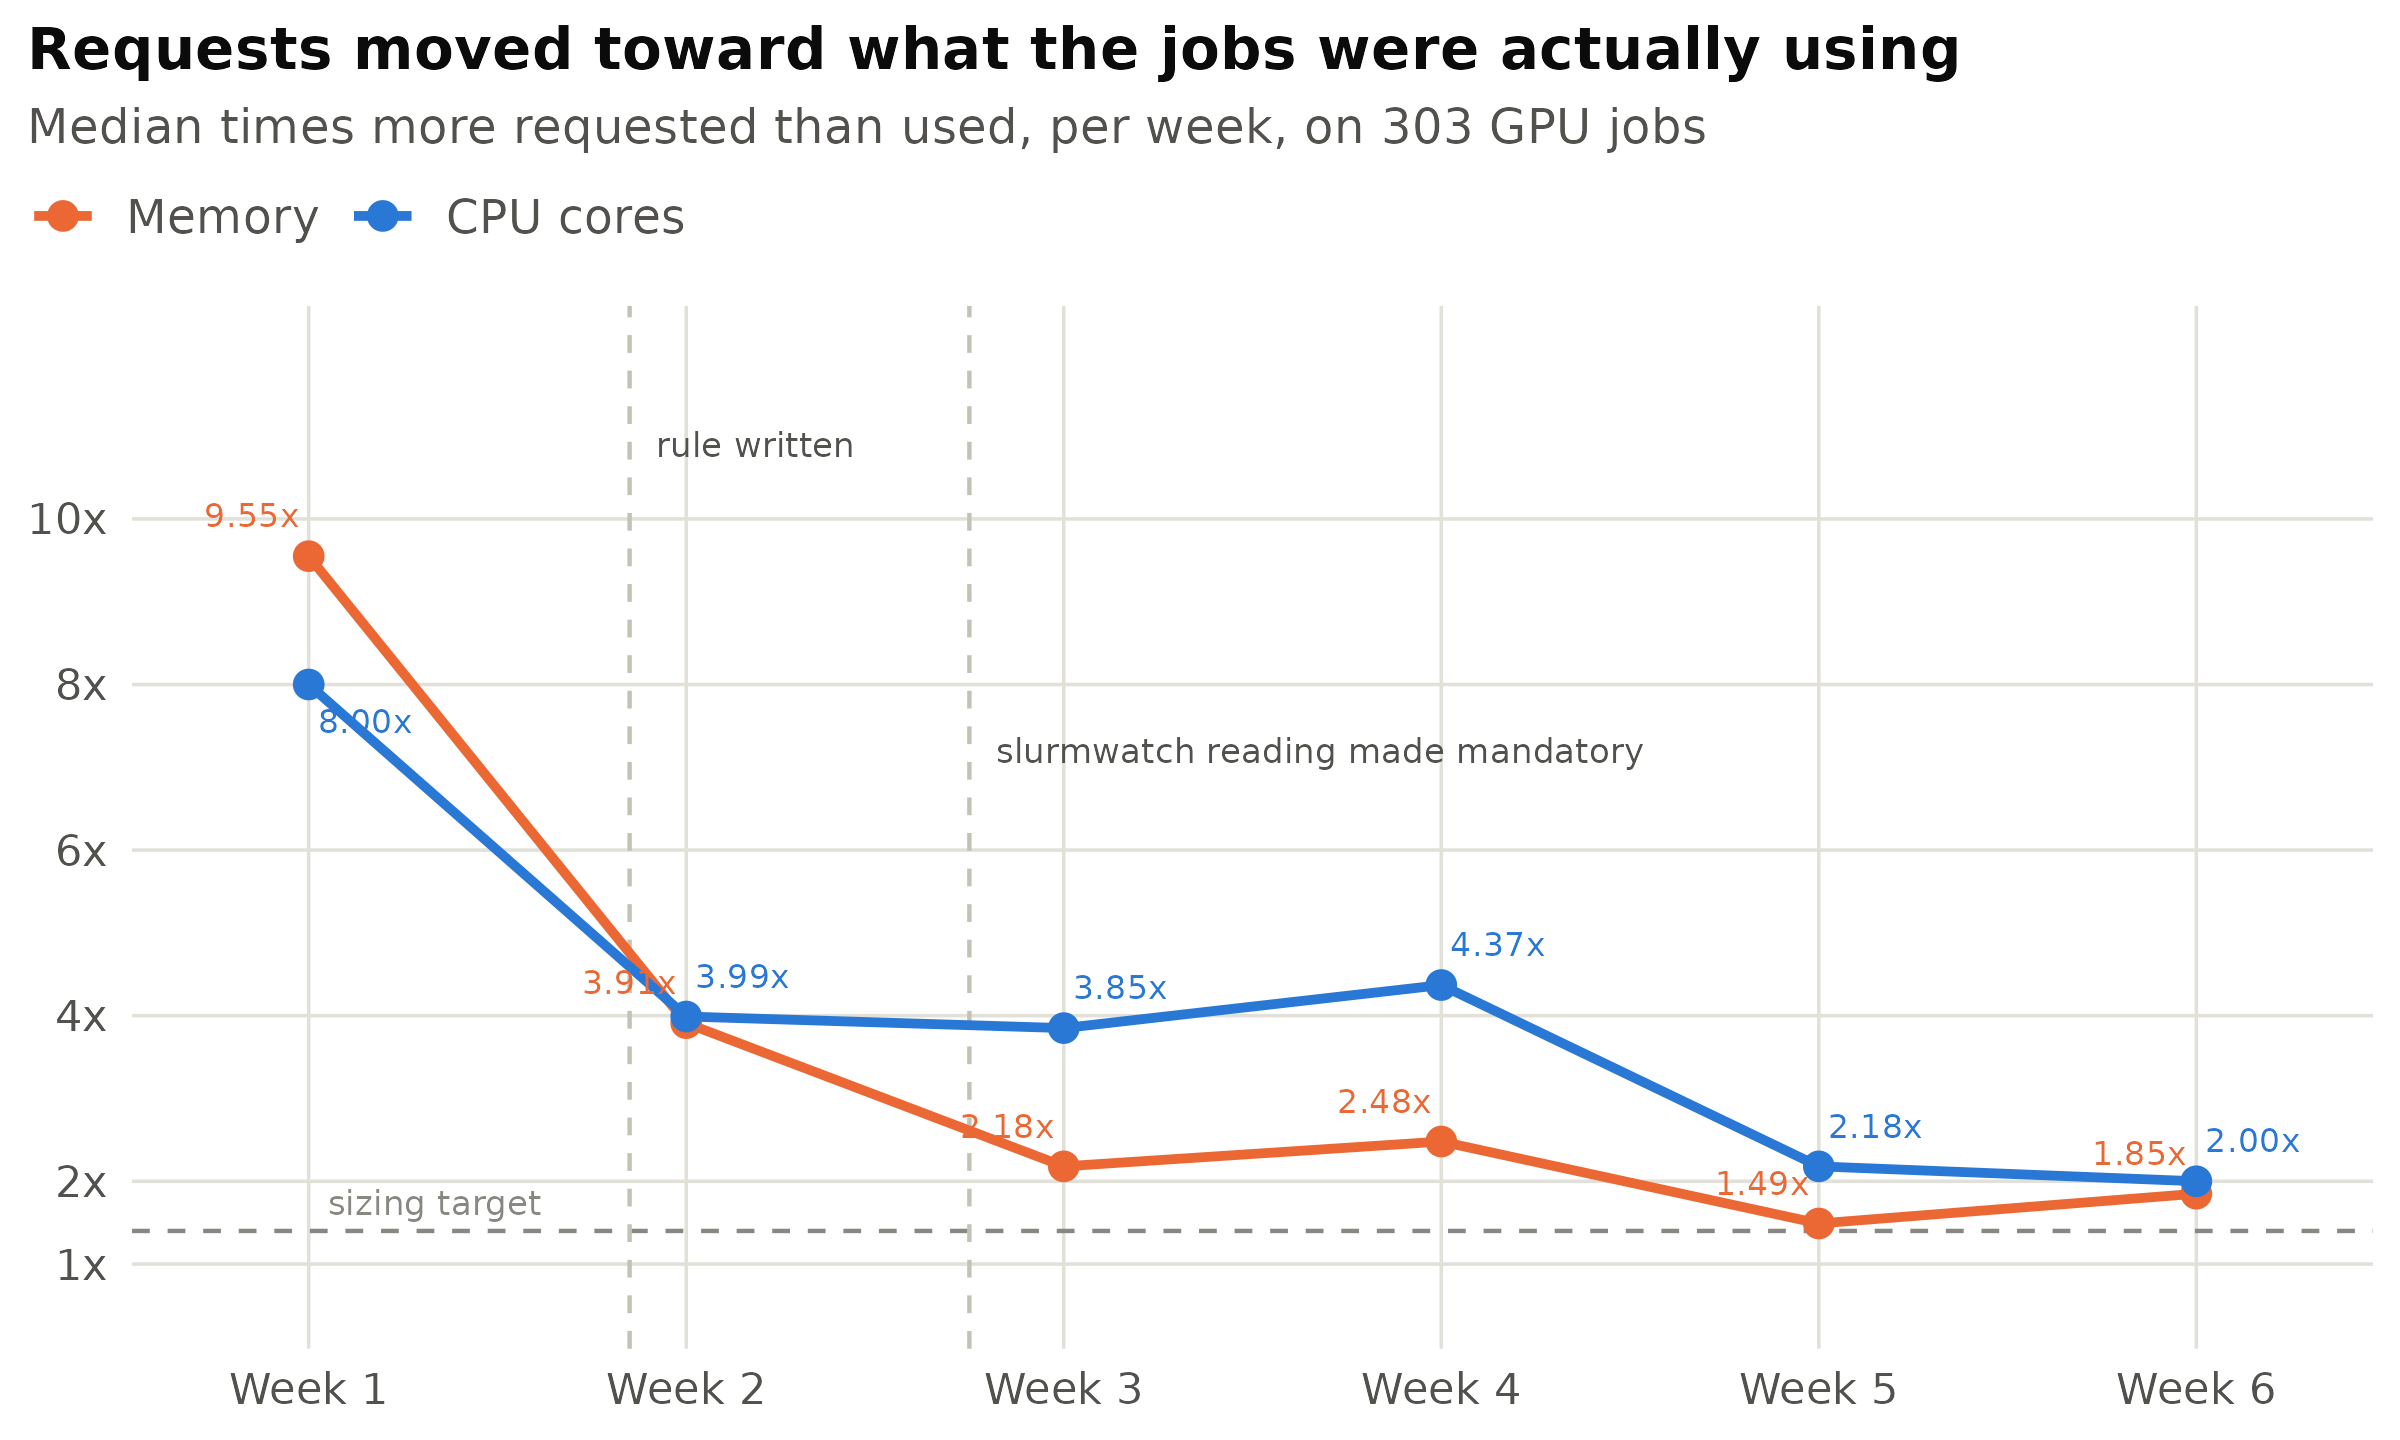
Figure 4: GPU jobs only, the one workload family present in every week, so the series is not confounded by new kinds of work arriving later.
Two qualifications belong with that fall. The jobs themselves grew, from a median real requirement of 9 GiB in the first week to 26 GiB in the last, so part of the closing gap is need rising to meet the request rather than the request coming down to meet need. And the largest single fall happens in week 2, before any slurmwatch reading was required, which is a fall the written rule can claim. What the instrument plausibly contributed is the second half of the descent, from roughly fourfold to roughly twofold, and that is exactly the range the older memory numbers could not resolve.
The corrections, one at a time
The change is visible in individual edits as well as in the aggregate. The transcripts contain 23 occasions on which Claude Code went back into a submission script it had already written and changed the memory or core request.
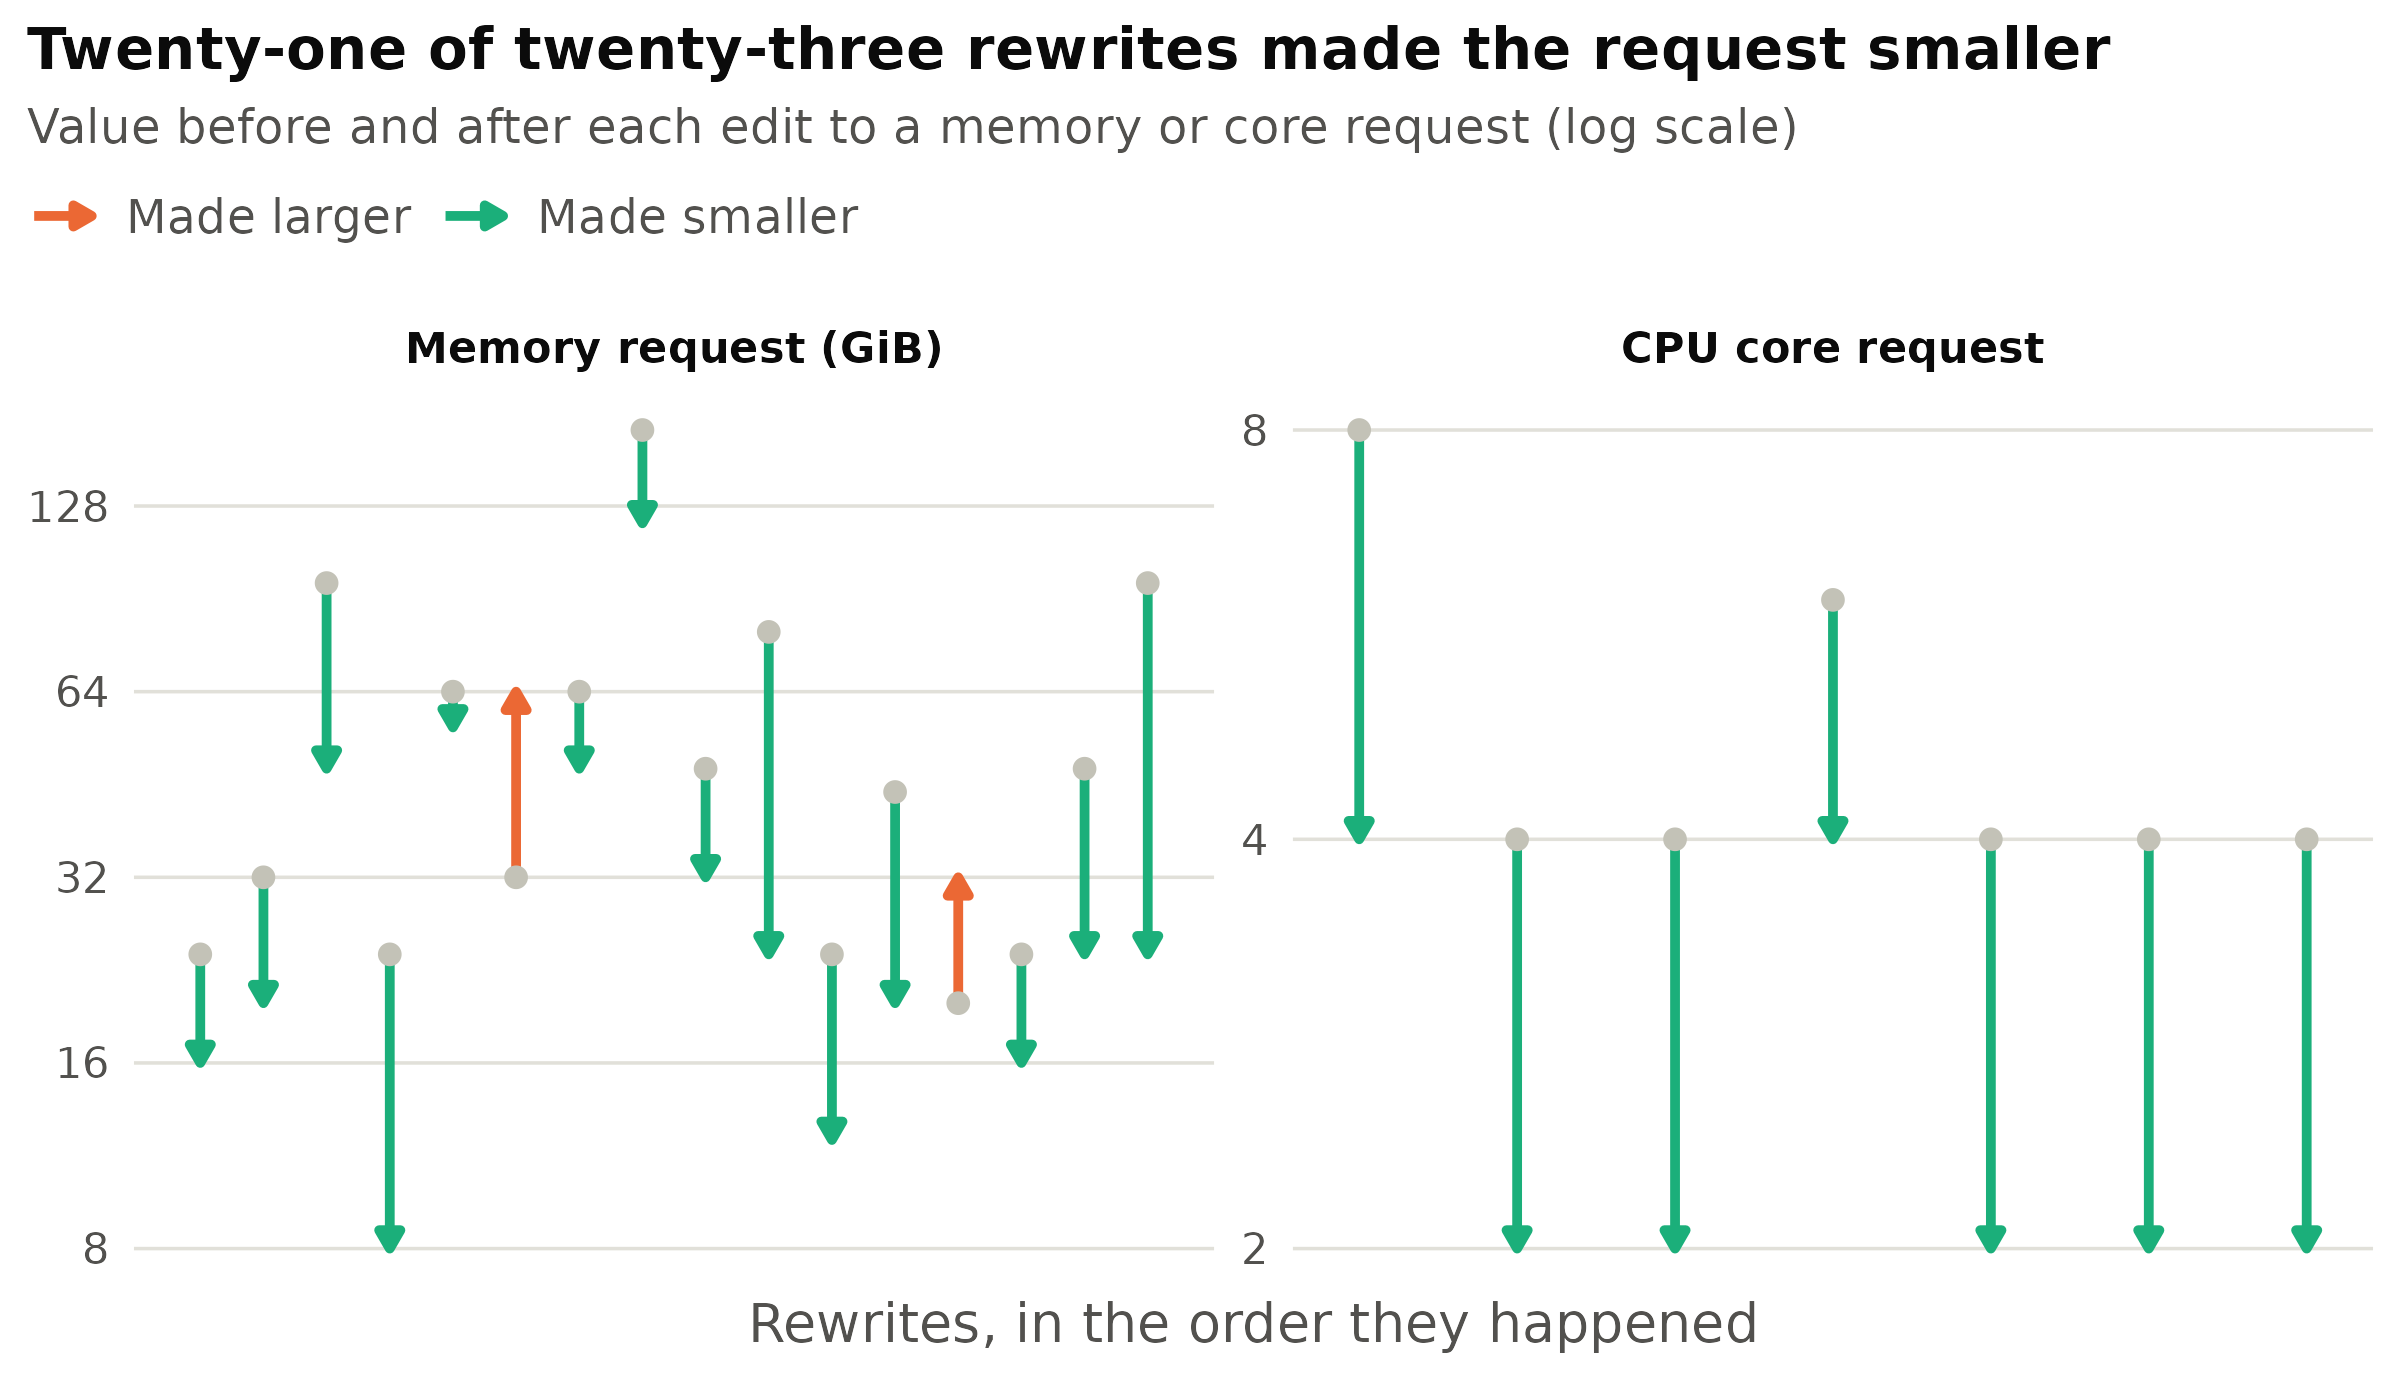
Figure 5: Fourteen memory reductions, seven core reductions, two increases. Edits to documentation, and multi-flag edits whose before-and-after pairing is ambiguous, are excluded.
Both upward arrows are the failure mode of tightening a request, and both took the same form: the request had been sized from a reading of one phase of a job with several phases, and the job was then killed in a later, heavier phase.
In the first, a 32 GiB request carried over from a standard evaluation was killed at a phase that loads a 34.6 GB checkpoint into memory. The request went to 64 GiB, but not before the underlying waste was fixed: the loader had been holding data it no longer needed, and releasing it dropped the peak from about 58 GB to about 46. A slurmwatch reading later showed a 32.9 GiB peak, and the request came back down to 48. In the second, a request cut to 20 GiB from a reading of the training phase was killed during a later checkpoint-merging phase that the reading had never covered.
Neither is an argument against measuring. Both are an argument for measuring a job all the way through rather than at a convenient moment.
Where the correction did not carry over
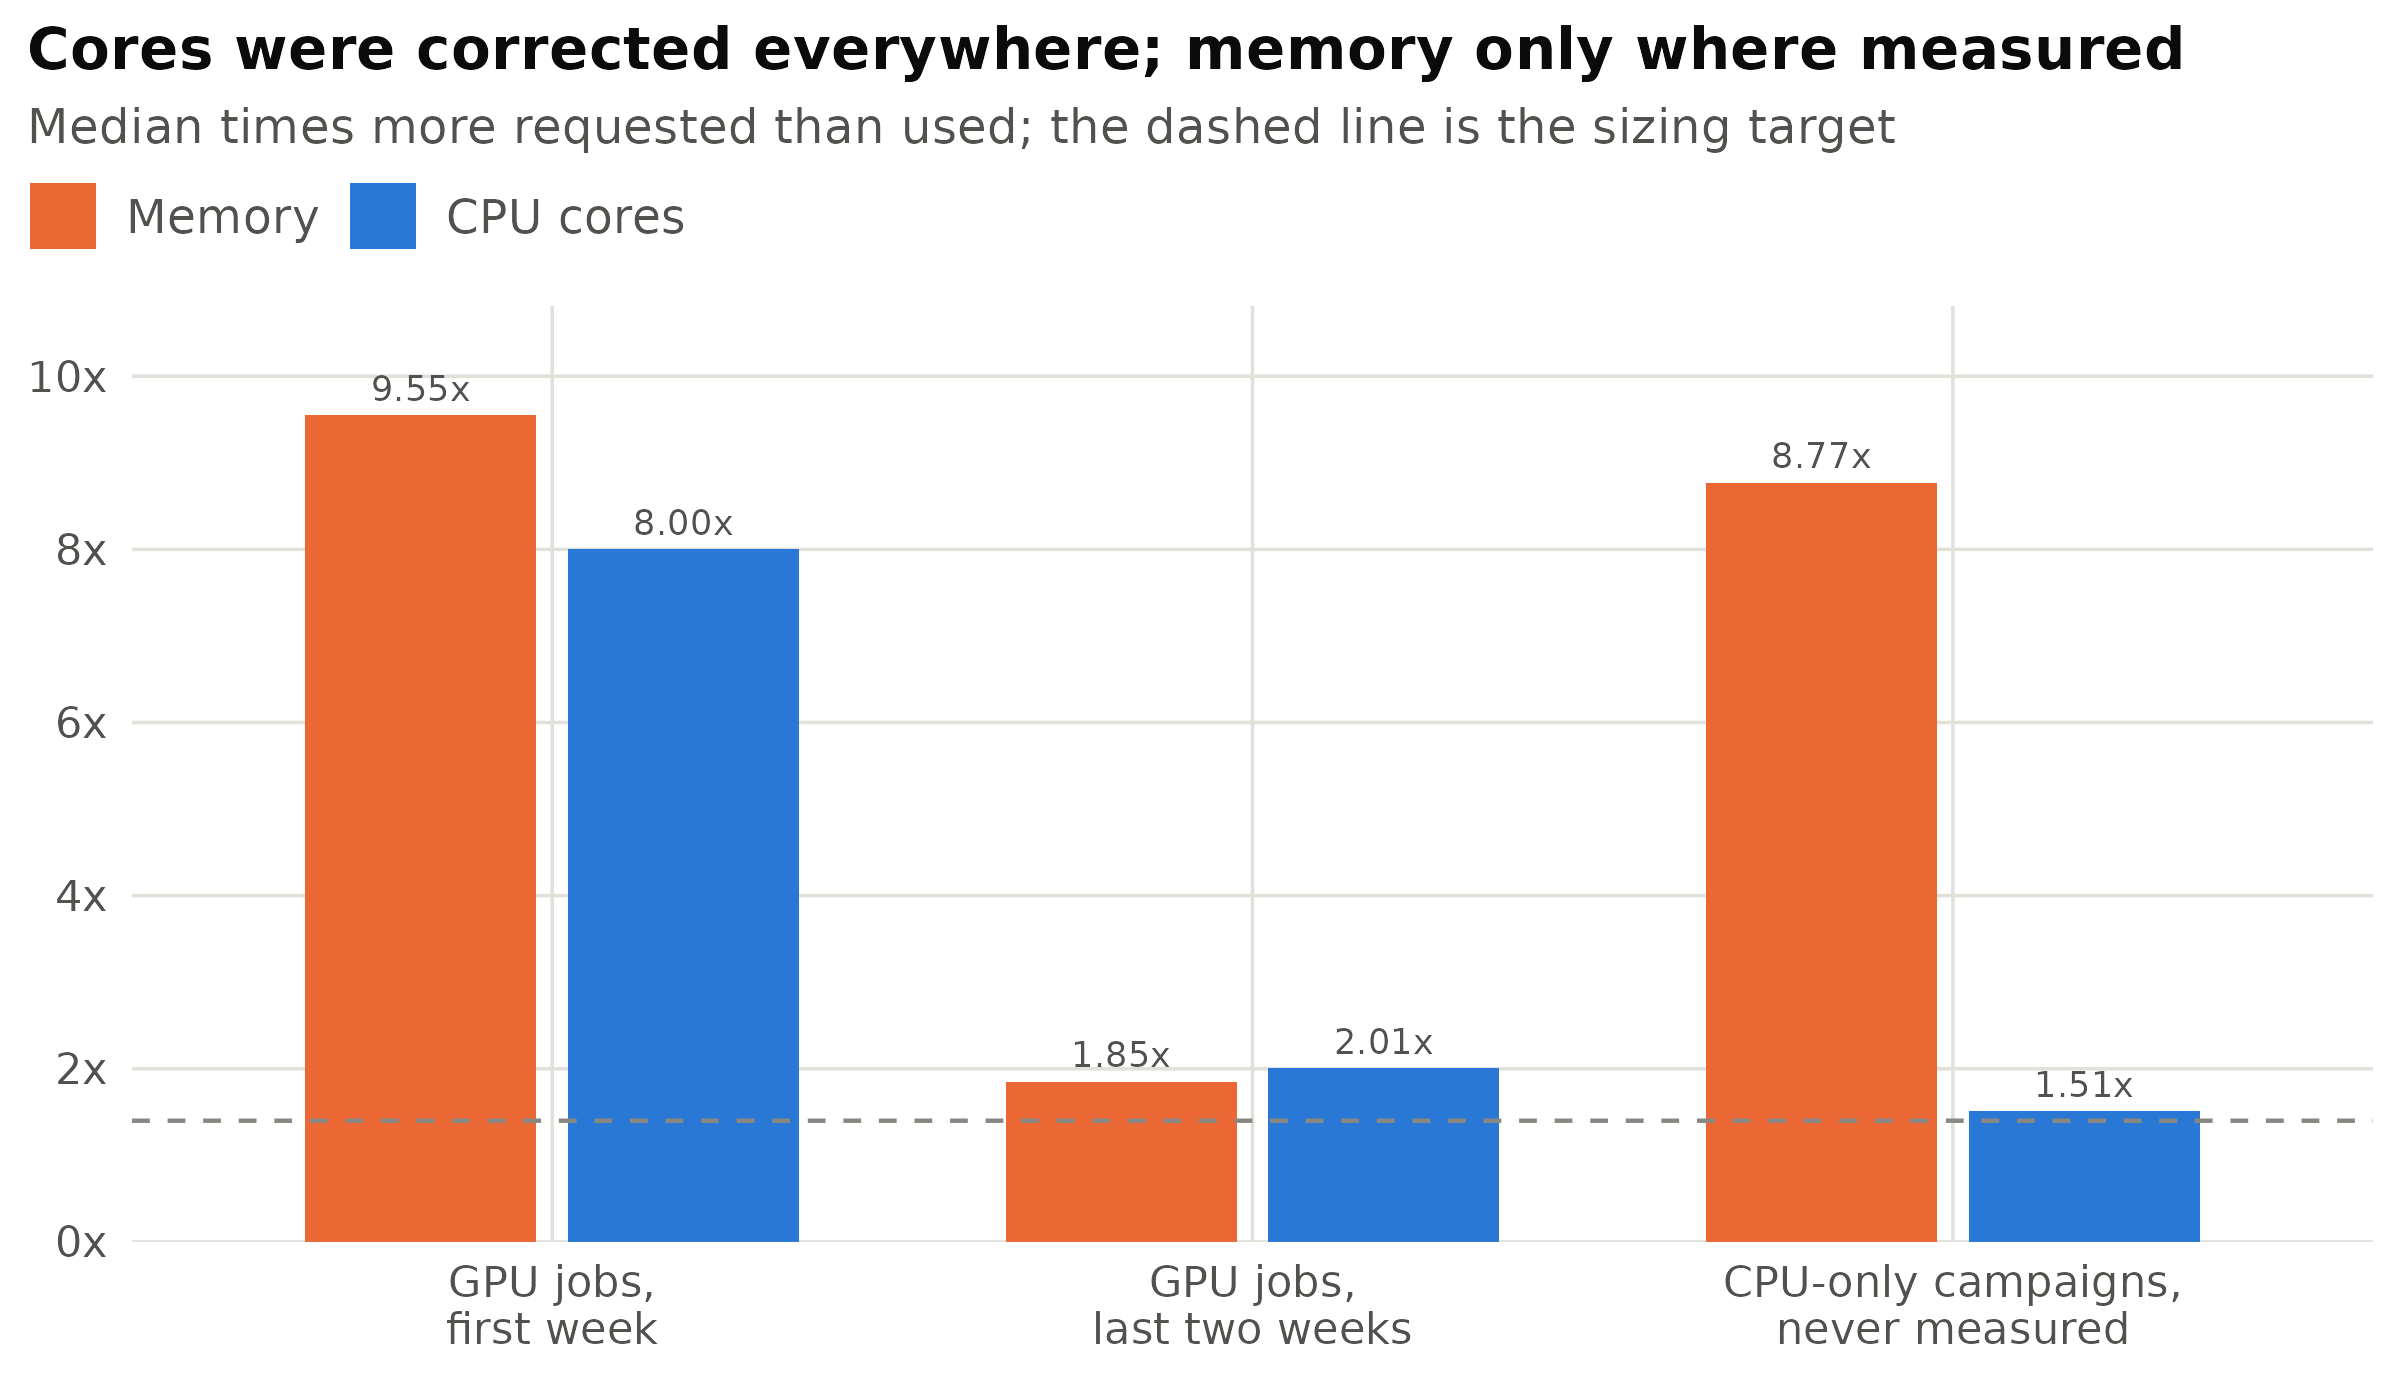
Figure 6: Group sizes 15, 145 and 3,173 jobs.
The GPU jobs in the middle group were watched: long, expensive, few in number, and a reading was taken while they ran. The CPU-only campaigns on the right were not, and their two bars diverge for a reason that has nothing to do with effort. A single-core task obviously needs one core, so the core request can be got right without measuring anything. Nothing about a job’s behaviour reveals its memory peak, so the memory request stays a round guess.
This is the point of the whole exercise. The rule applied to every job in Figure 6. It was not being ignored. There was simply no reading to size against, and without one the instruction to avoid over-requesting collides with the instruction to avoid killing the run. The second wins, correctly, every time.
A request that was correct when it was written
Every over-request so far was wrong when it was typed. One was not, and it is the more instructive case.
A multi-week pretraining run reserved 64 GiB per slice against an 8.55 GiB peak. But that request had once been right: resuming used to copy the checkpoint into process memory on each of three ranks, and the job had genuinely been killed for it. The load was later changed to map the checkpoint from disk, which left the host holding only reclaimable page cache. The transient the 64 GiB existed to survive stopped existing; the comment justifying it did not change with it, still naming the old loading mode and a checkpoint size that had since doubled.
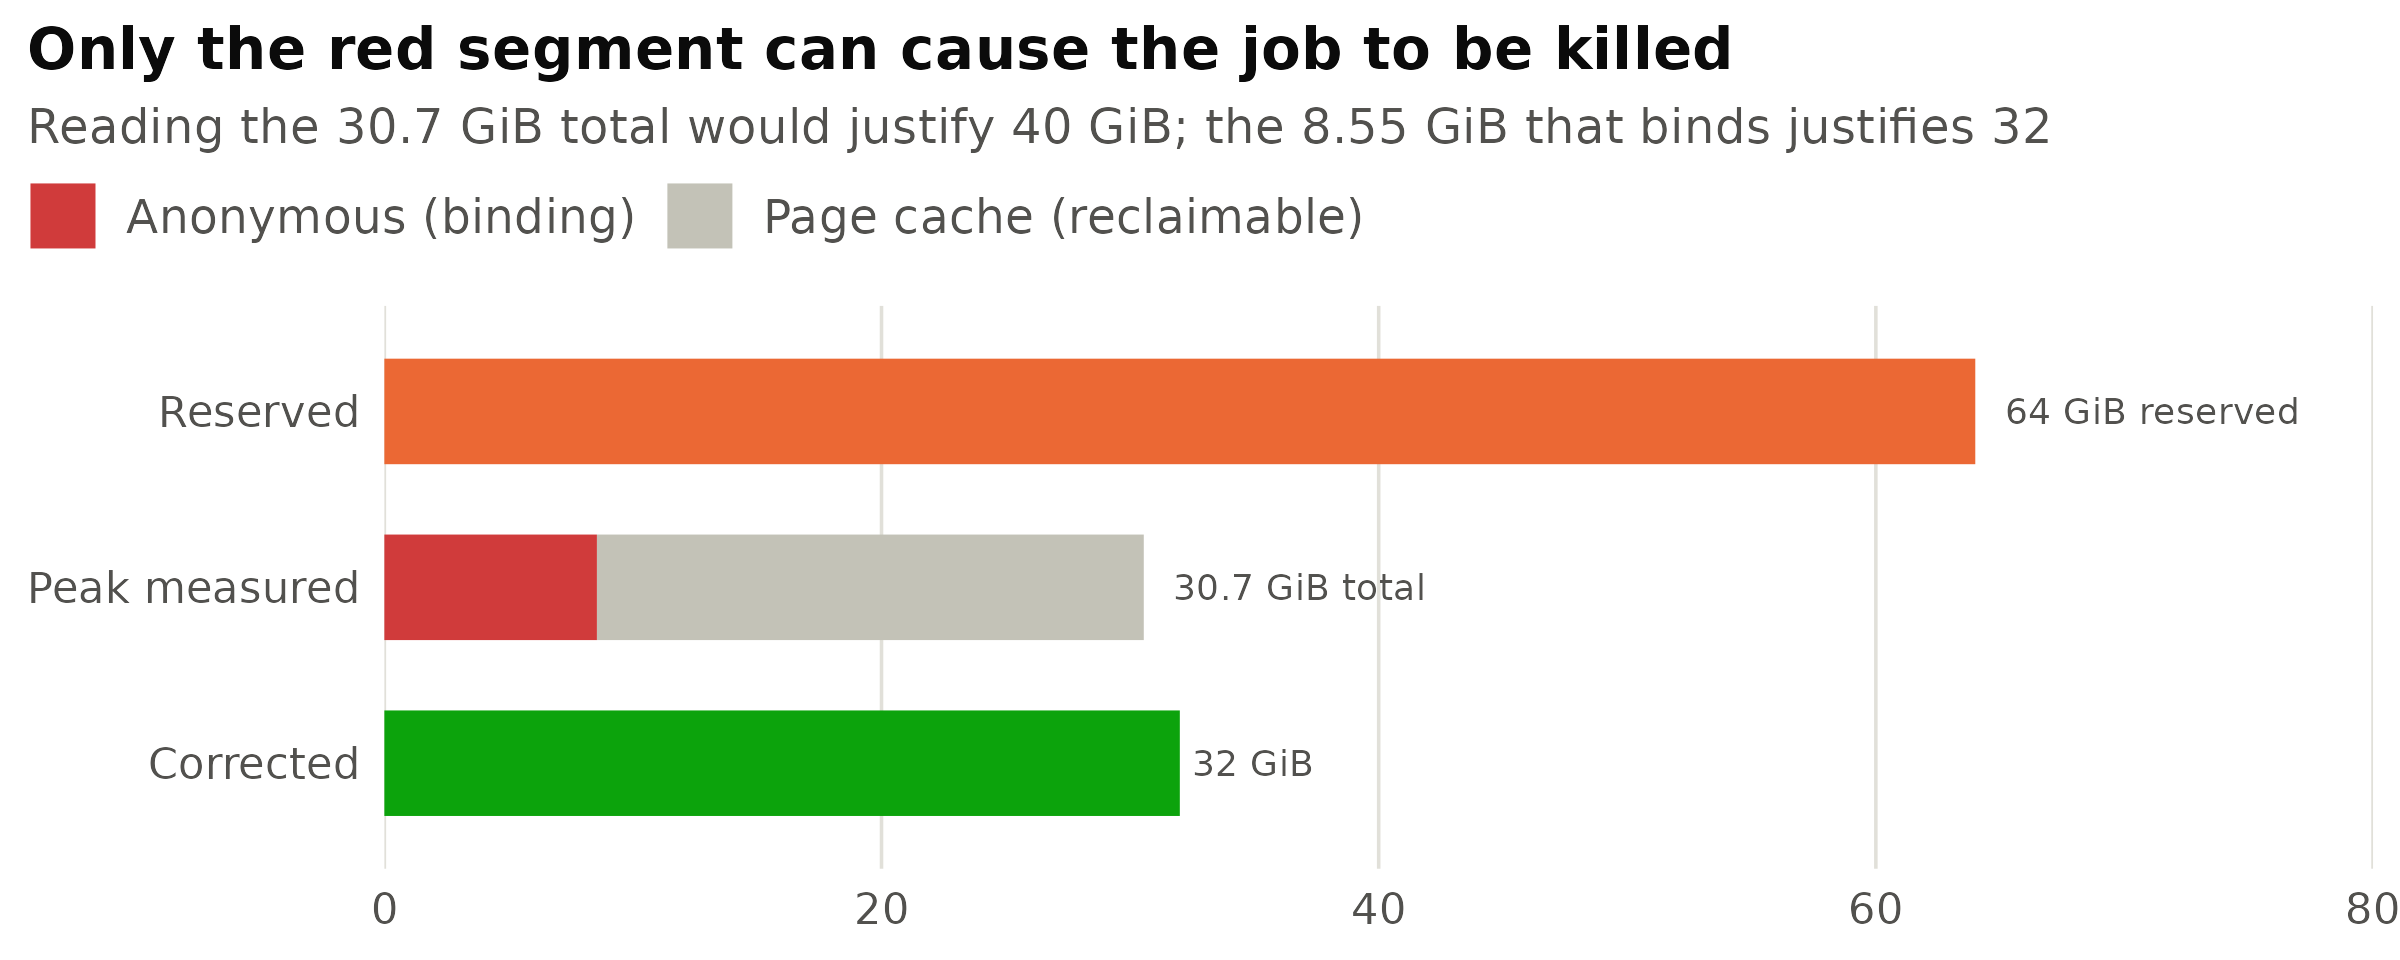
Figure 7: One slice of the run. The measured bar is split into the part that can kill the job and the part that cannot.
Two things separate this from the rest of the article. The justification was the problem rather than its absence — sized for a measured 40 GiB resume peak is what a reviewer wants to see, and it is what stopped anybody looking again. And nothing in the submission script changed: the request went stale because code elsewhere got better, which no submit-time check is arranged to notice.
Three preventives follow. Sizing comments should carry the date and the command that produced the number, so their age is visible. Any change to how much a job holds in memory should invalidate the request sized against the old behaviour, as changing a function’s contract invalidates its callers. And long runs should be re-measured periodically, since those are the ones that outlive their assumptions.
The costliest version of the same mistake
slurmwatch’s other two numbers are about the GPU, and they answer a question that memory and cores cannot: did the job need the accelerator it was given at all? Of the thirteen measured jobs with a usable GPU reading, three were holding a card whose memory was more than ninety-five per cent empty, and reporting no activity on it either. On this cluster a GPU is the scarcest thing a job can reserve, so that is the same error as a 96 GiB memory request, made against the expensive resource.
That reading needs more care than the memory one, and the record contains the trap. One job showed ninety-three per cent of its cards’ memory occupied and zero activity, which looks like the same failure and is not: it was a training run that completed its full slice normally, caught by the snapshot at an idle instant. A card whose memory is almost empty is unambiguous. A card that merely looks idle may just need looking at again a few minutes later. The companion article works through that distinction and the tuning it leads to; this one stops at the request.
Why an instrument and not a better prompt
It is tempting to read all of this as a shortcoming of one tool, fixable with a stronger model or a firmer instruction. There is no stronger model to reach for — the record is Opus 5 at maximum reasoning effort from end to end. The record does not support the instruction either, for three reasons.
The answer is not in the code. How much memory a program needs depends on the data it is given, the libraries it links, how much file content the kernel decides to cache, and how many worker processes a framework happens to start. None of that is visible in the source. The video encoder that saturates at five cores looks, in its invocation, exactly like one that would use sixteen.
Success reports nothing. A job that completes gives back no information about its footprint. A request is written, the job succeeds, and the next request is written by the same reasoning that produced the last one. Every correction in this record came from a human reading a dashboard, not from anything Claude Code could have noticed by itself. They cluster in the first three days, which is what a standing instruction is good for, and then recur weeks apart, which is what an instruction alone does not reach.
The easy measurements pointed the wrong way, as Figure 2 showed. This is the reason Figure 4 falls in two stages: the written rule removed the round numbers, and slurmwatch removed the remaining factor of two.
What closed the gap was making one reading mandatory and naming the four numbers to take from it. That is a two-second command against a running job. It converts a question that cannot be answered by reasoning into one that can be answered by looking, which is the entire contribution of the tool.
Limitations
The all-jobs figures for memory rest on Slurm’s MaxRSS, which this article has just spent a section
criticising. That is unavoidable: it is the only memory figure Slurm retains for every job. Its bias runs
one way, and the direction matters. Because MaxRSS reads high, the percentages in Figure 1 are upper
bounds and the multiples elsewhere are lower bounds. The real gap is wider than reported here, not
narrower. Where a slurmwatch figure exists, in Figures 2 and 3, it is used instead.
The 21 measured jobs are not a random sample. They are the jobs somebody thought worth watching, which biases them toward long, expensive and suspicious runs.
Figure 4 cannot separate the effect of the written rule from the effect of the instrument, since the two arrived six days apart while the workload mix was also changing. The claim made is the modest one: the fall from roughly 4x to roughly 1.8x coincides with the instrument and lies in the range the older numbers could not resolve.
Finally, this is one tool, one operator and one cluster. The structural argument generalises, because the missing feedback loop and the misleading memory numbers are properties of Slurm rather than of anything reading it. The particular numbers should not be assumed to.
Summary
Across 761 submissions and 4,950 jobs, Claude Code reserved 25,888 gibibyte-hours of memory for work whose peak demand was 10,696, and 3,473 core-hours for work that consumed 963. The median job used 12.9 % of the memory it asked for. Four jobs in five used under a quarter of it.
A written instruction to stop cut the worst of it, from 9.55 times what was needed to about 4. A mandatory slurmwatch reading took it the rest of the way, to about 1.8. Where no reading was taken, memory requests stayed nearly nine times the recorded peak under the same rule, because without a measurement the safe guess is a large one.
Claude Code is not bad at HPC work. It is blind to one specific quantity; the blindness is a property of the system it works in rather than of its reasoning; and the remedy is a two-second reading rather than a better prompt. That is the case for keeping slurmwatch on the job.