slurmpast: Post-Mortem Analysis for Finished HPC Jobs
Contents 12 sections
- Three instruments, three moments
- The instrument
- Three failures no single reading can reach
- The verdicts the record produces
- The value of acting on them
- Allocations that held a card and computed nothing
- Failures that belong to the machine rather than the job
- The coverage of each instrument
- Interfaces for automated use
- Limitations
- The record the agent does not keep
- Availability
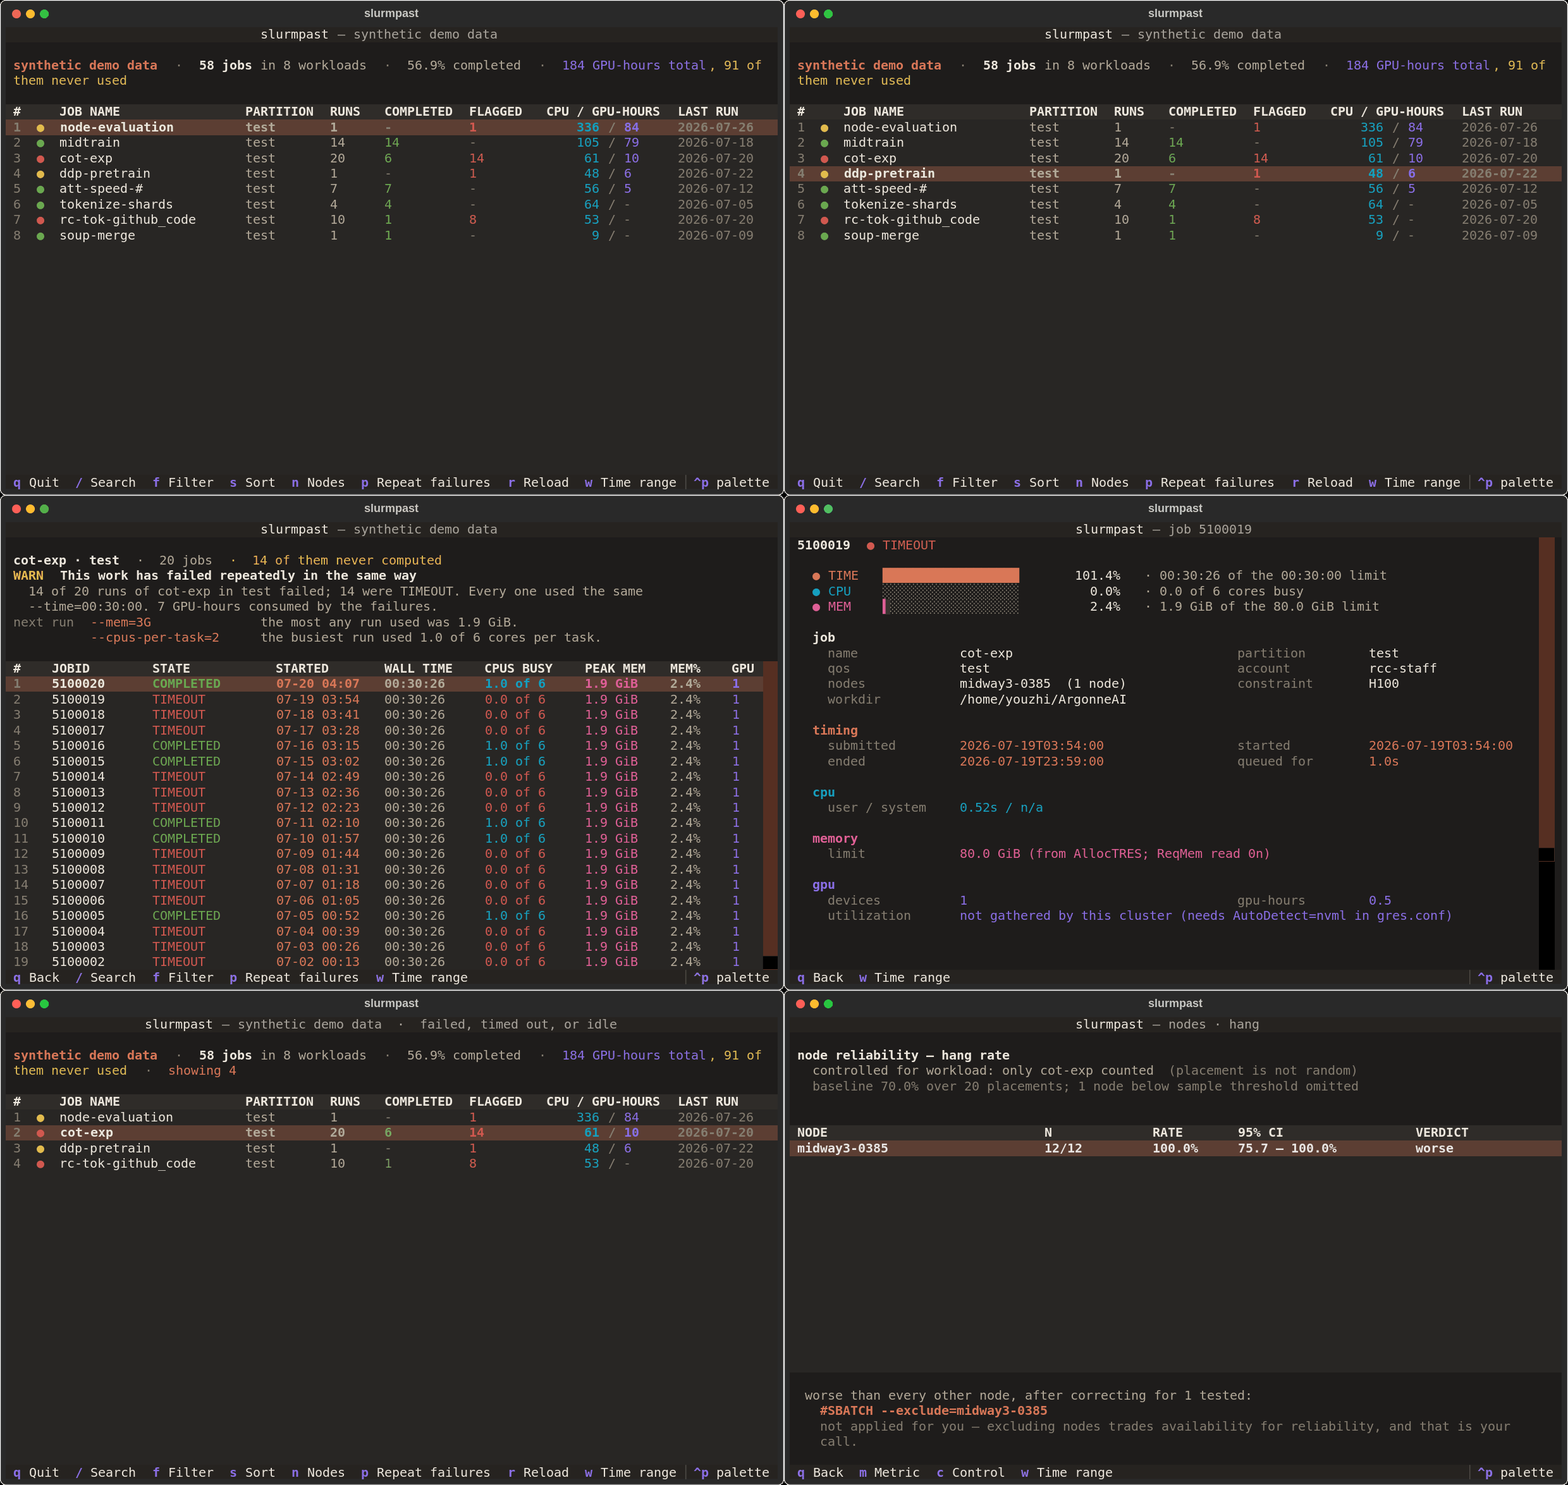
slurmpast is an open-source command-line tool that reads what a set of finished jobs actually did, and states what the next submission should ask for. It is the counterpart to a tool introduced here earlier: slurmwatch reads a job while it is running; slurmpast reads the accounting record after it has stopped.
pip install slurmpastslurmpast # dashboard, last 7 days
slurmpast --sizing # what to request next time, per workload
slurmpast 51170455 # one job, every field the scheduler recorded
slurmpast --demo # no Slurm to hand? a synthetic history
sp # short alias
It requires Python 3.10 or later and depends on textual and rich for the interface; every module
that performs analysis imports nothing outside the standard library. The licence is MIT.
This article describes the package, and then uses it on a real accounting history to extend an argument made in an earlier article, Correcting Claude Code’s Cluster Resource Requests with slurmwatch. That article established that Claude Code requests far more memory and processor time than its jobs consume, and closed with a remedy: take a live reading and size the request against it. The remedy is correct and it does not scale, for a reason that can now be measured. A live reading requires a person to be present while the job runs. The accounting record requires nobody, and it has already been written.
Every number below comes either from the package’s own source and tests, or from one Slurm accounting
history on a university cluster. That history holds 13,954 usable records, after excluding 357
synthetic sleeper jobs written to exercise slurmwatch. Of those, 6,744 allocations from 991
submissions can be attributed to Claude Code by the job identifier sbatch printed back into a
session transcript, and those are the jobs used wherever this article discusses requests.
Three instruments, three moments
The three questions that arise around a submission need three different instruments, because the evidence for each exists at a different time.
Before the run. What should be requested for work that has never been run? slurmate constructs the request.
During the run. Is the job using what it was given? slurmwatch reads the compute node live. It is the only one of the three that can measure a job’s genuine memory requirement, because that quantity exists only while the job is running.
After the run. What happened, and what should the next submission ask for? That is slurmpast. It is the only one of the three that reads every run of a piece of work at once, and several of the most expensive mistakes in the record used below are invisible within any single run.
The division between the second and the third is not a matter of taste. A live reading has to be taken while the job occupies the node, and most jobs are not there for long.
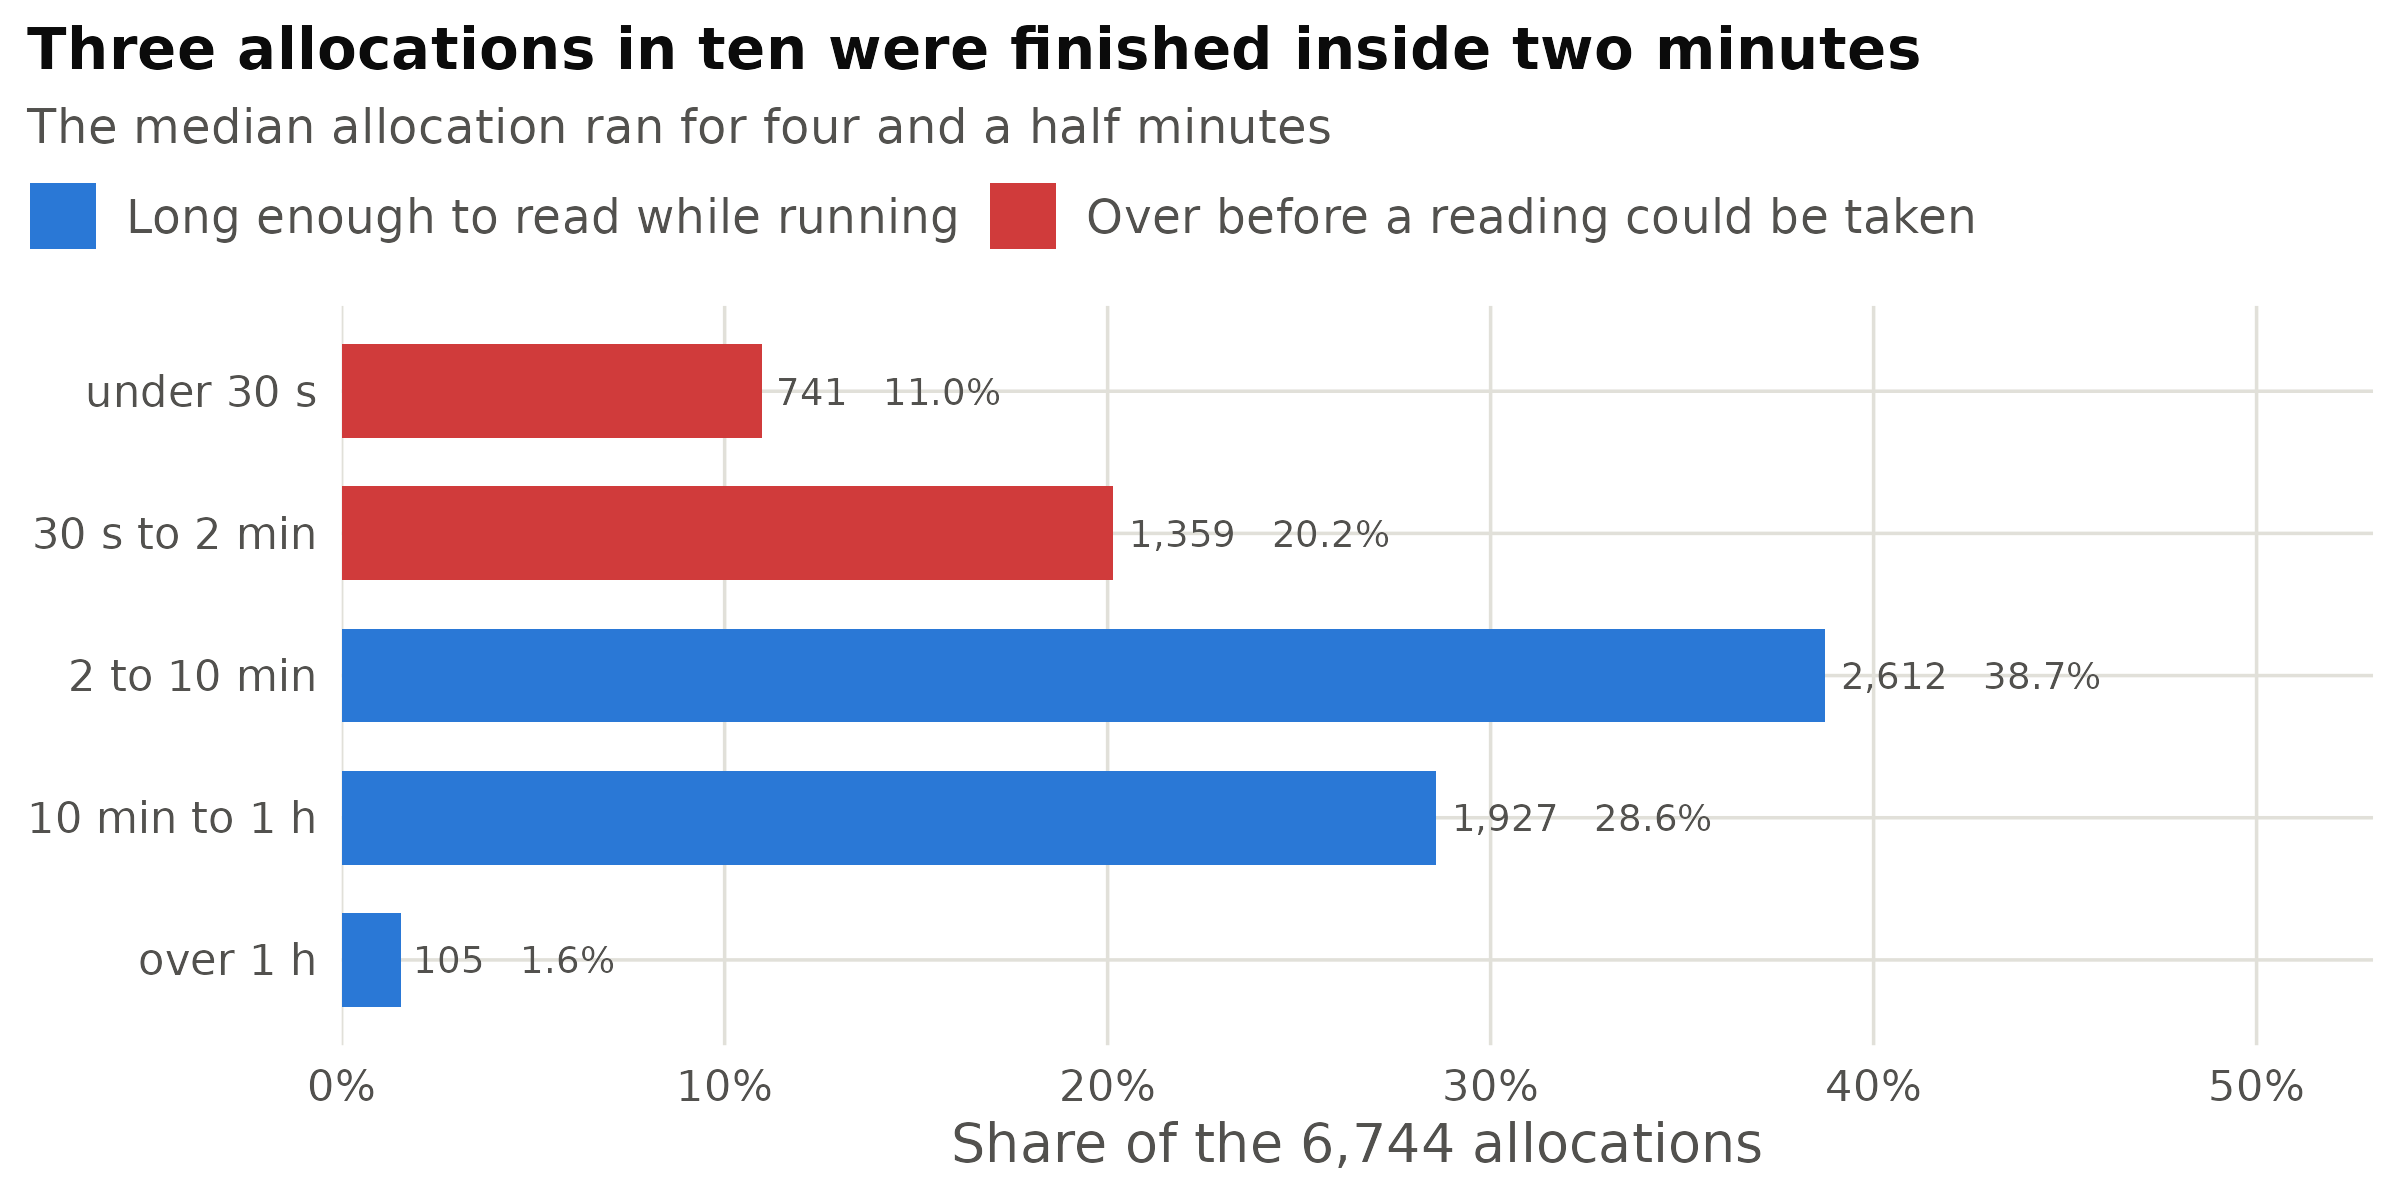
Figure 1: The 6,744 allocations in this record that are attributable to Claude Code, by how long each one ran. The earlier article reported live readings for 21 jobs, which was not a failure of diligence: it is approximately the number of runs a person can stand over. The accounting record covers all five bars equally, and is written whether or not anyone intends to read it.
The instrument
The workload rollup
A list of 13,954 records answers no question, so the opening screen groups runs into workloads and ranks them by the compute they consumed, which places a five-run group costing four hundred GPU-hours above four hundred two-second probes.
Grouping is not by job name, because names encode parameters and barely group at all. Collapsing runs
of digits folds s1e20 and s2e47 into one pattern, s#e#, and a column records how many real names
each pattern covers. Here that turns 523 distinct names into 470 workloads. Ranking those by compute is
what makes the screen finite, because the distribution is extremely uneven.
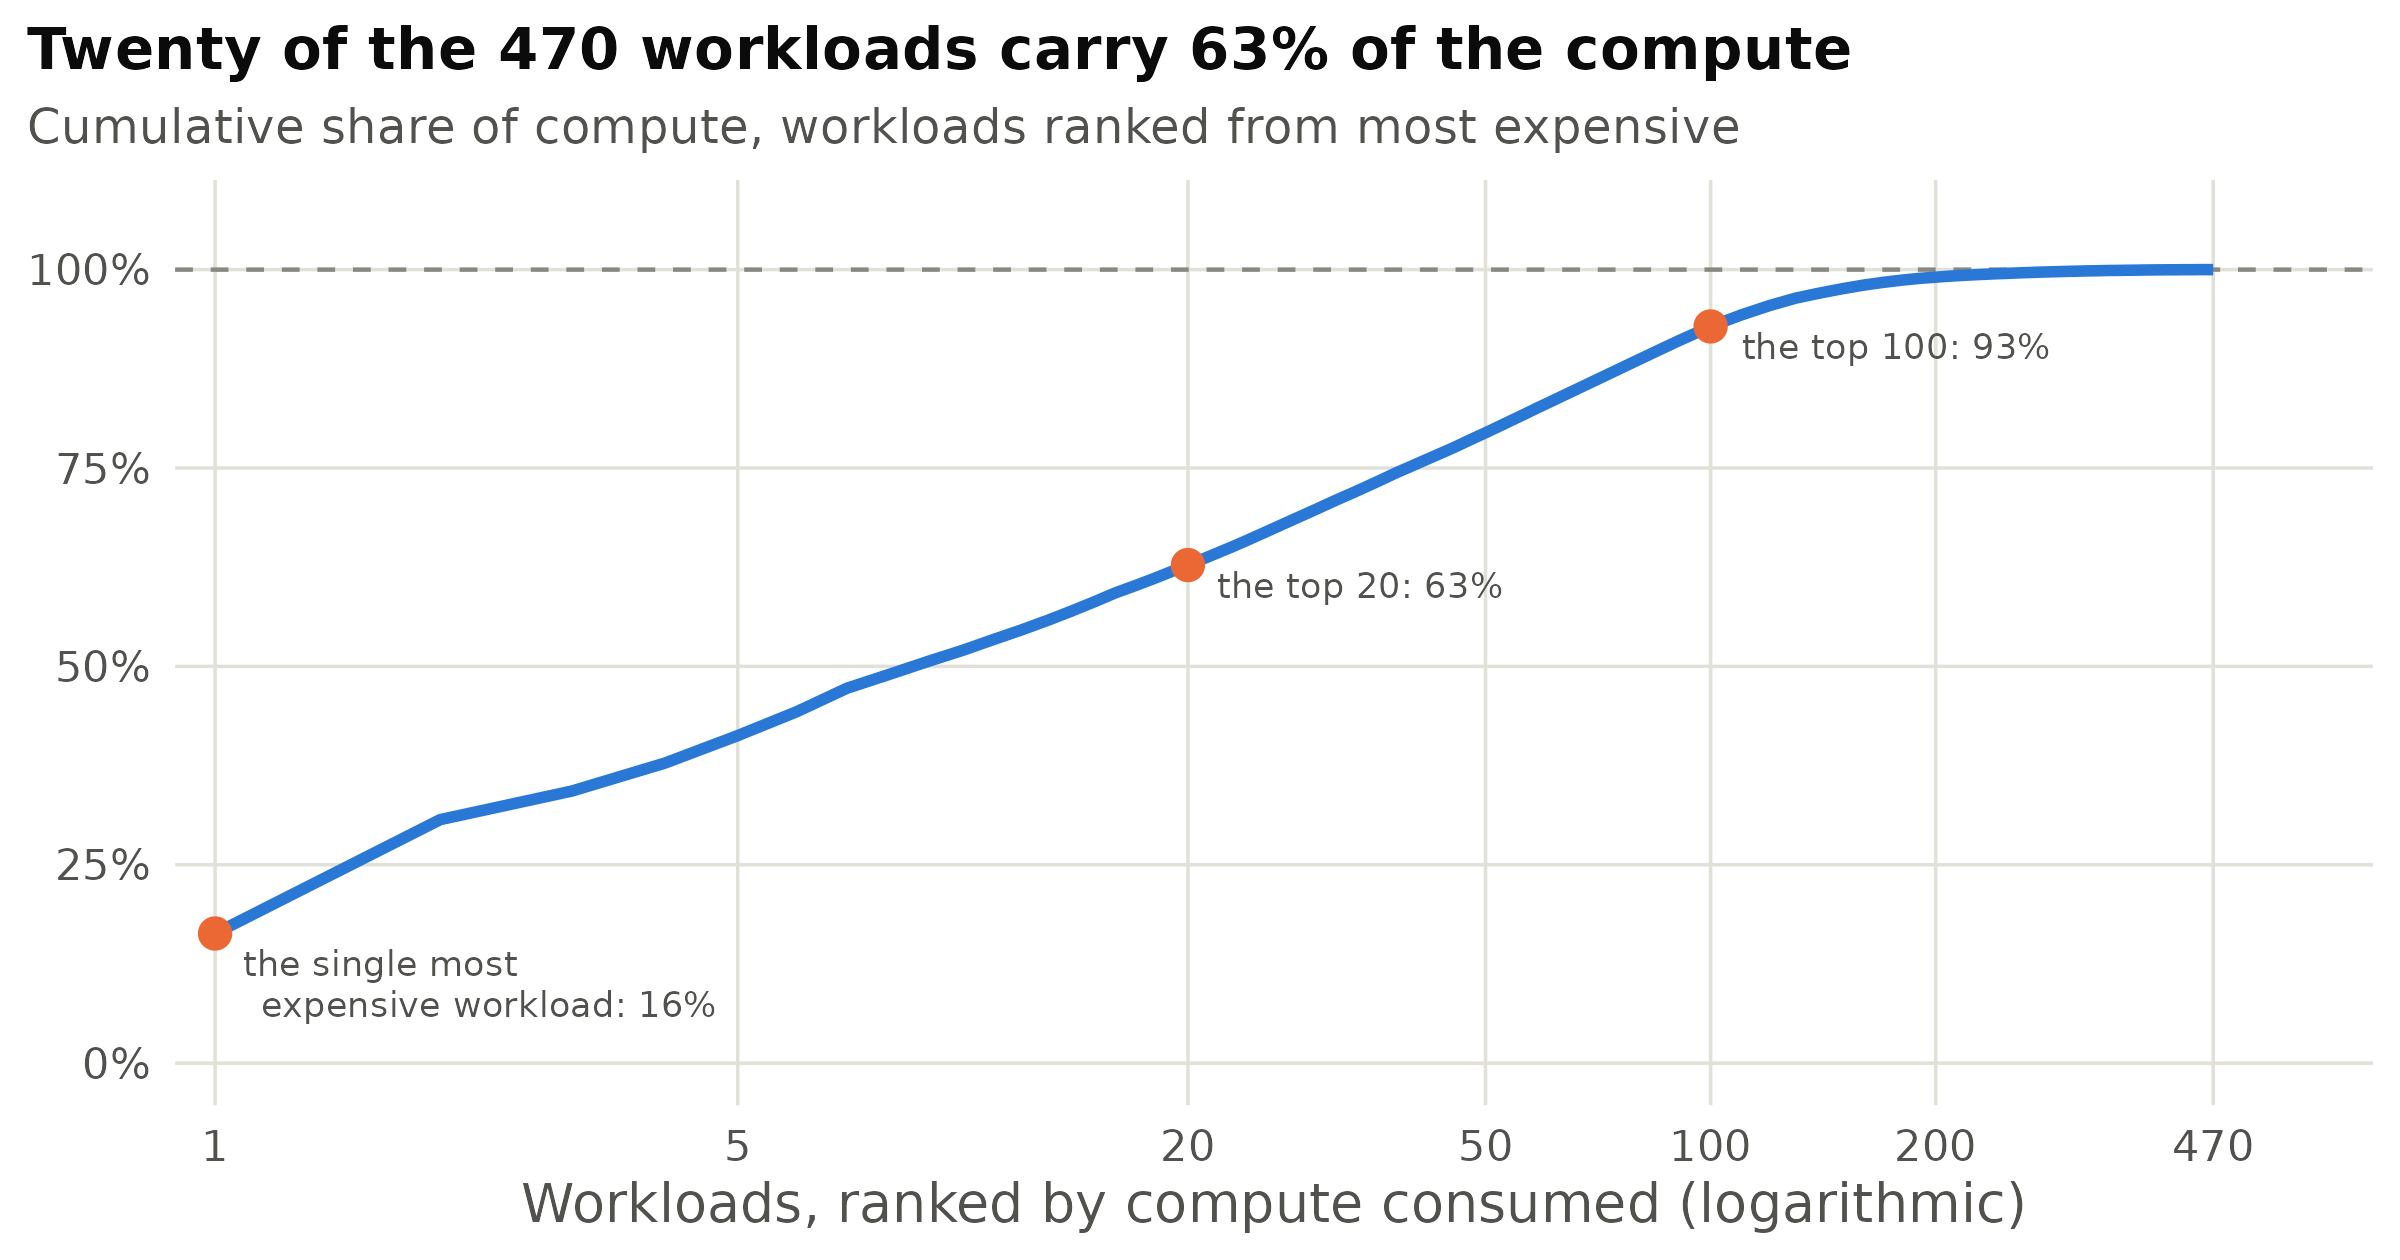
Figure 2: Cumulative share of compute across the 470 workloads, ranked from most expensive. Compute mixes the two resources at one GPU-hour to sixteen CPU-hours, which is roughly the hardware ratio on this cluster. The single most expensive workload is 16 per cent of the total on its own, and the bottom 270 workloads are the last 7 per cent between them.
Every terminal listing in this article would otherwise have come from slurmpast --demo, the synthetic
history the package ships so that the tool can be evaluated without a scheduler. The figures use the
real one instead. Real job names, script names and project names are omitted throughout; real workloads
are described by the work they performed.
One job against its own limits
A job identifier produces the post-mortem for that job: the three quantities that have a ceiling drawn against that ceiling, then every field the scheduler recorded, the log excerpts if the files remain on disk, and the findings. One real run from this record is drawn below exactly as the tool draws it.
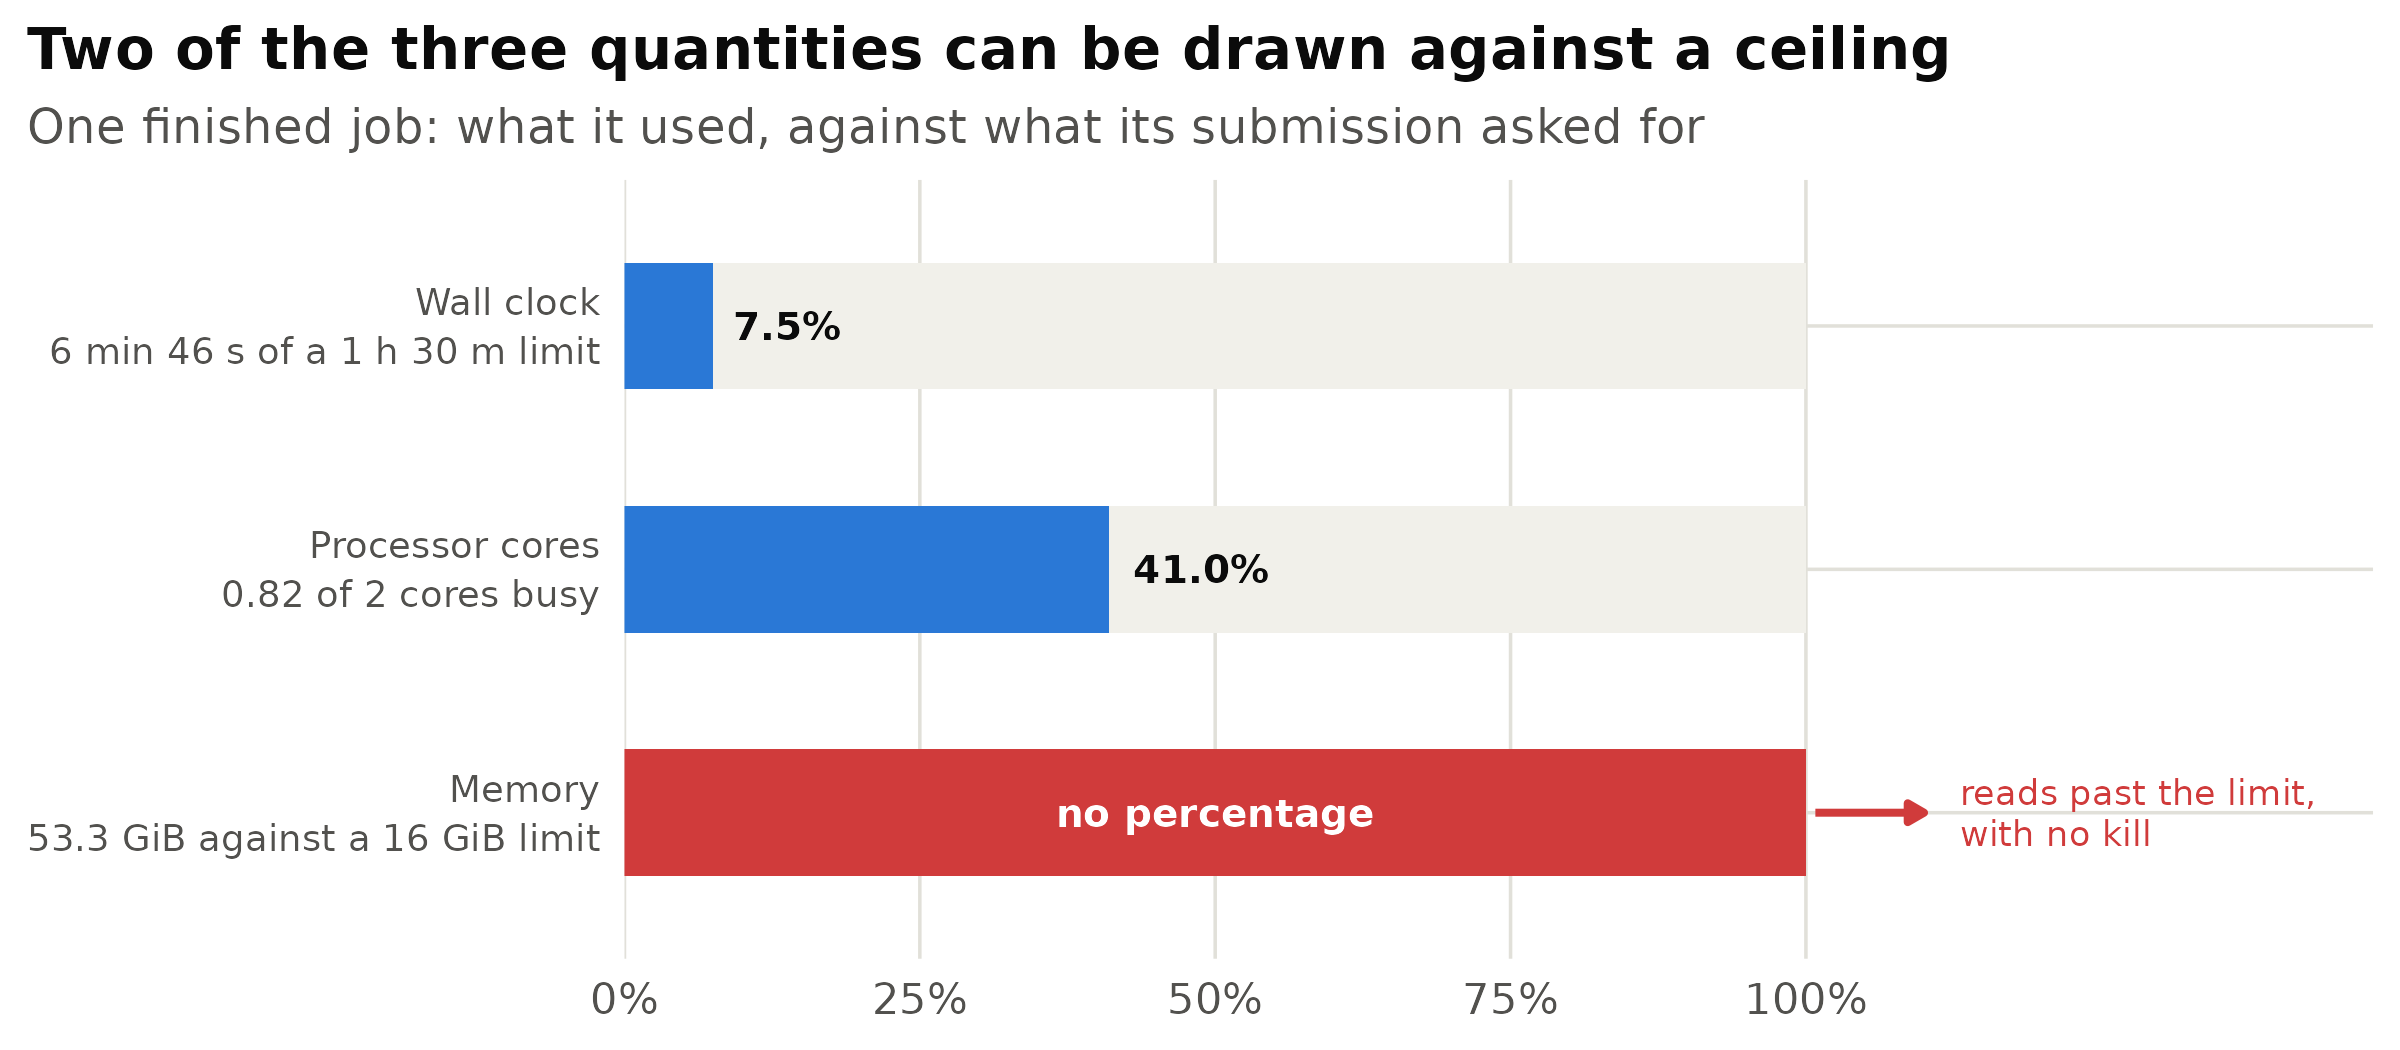
Figure 3: One completed run, an evaluation on a single card. The faint bar is the limit the submission requested; the solid bar is what the run used. The two findings the tool raises on it are that the time limit is far larger than needed, and that the memory figure cannot be trusted as a footprint. A third, not shown here, is that 48.7 per cent of its processor time went to the kernel rather than to its own code.
The memory row is the one that constrains everything after it. It declines to print a percentage,
because the figure exceeds the limit and the job was not killed, so the figure cannot be this job’s
footprint. MaxRSS is the only memory figure the scheduler retains for every job, and under the
process-tree accounting used on many systems it sums memory across processes, counting shared pages
once per process. It reads high, sometimes by a large factor, and any advice derived from it inherits
that bias. The finding raised in place of the percentage refers the question to the other instrument.
The next request, derived from the previous ones
--sizing converts the history into a request. For each workload it reports a verdict on the three
flags that are actually written by hand, a one-line basis for that verdict, and a #SBATCH line ready
to paste. Where fewer than three usable runs support a verdict it states not enough evidence rather
than producing one, and where the evidence points somewhere other than the flag it declines: a
workload whose timed-out runs consumed almost no processor time gets no time advice at all, because
those runs were blocked rather than slow and a longer limit buys a longer hang.
Each verdict is measured against the limit the most recent run requested, not the largest in the
window. Those two differ from the moment a request is being tuned, and the window is deliberately
constructed to span that tuning: grouping ignores resource magnitudes, so raising --mem does not
fork the history one is attempting to learn from. What this screen produced on the record used here is
the subject of two figures further down.
Patterns that exist only across runs
Three checks examine a workload rather than a job. Repeated failure: seff describes one job and
slurmwatch one live run, so neither can report that a piece of work was submitted 115 times and died
99 times. Where every failing run carried an identical request, the check says so, which separates a
limit that is too small from a program that is broken. A memory request being searched by hand: a
sequence of kills with the request stepping up and down. Where the same value both failed and later
succeeded, the check draws the conclusion that follows and declines to suggest a further increment.
Allocations that computed nothing: runs that held their resources for hours while consuming almost
no processor time.
Each of the three fired on the record used here, and the next section is what they found.
Machine reliability, controlled for workload
A job may also fail for reasons unconnected to the person who wrote it. --nodes reports each
machine’s failure or hang rate with a confidence interval and, where the evidence supports one, a
ready-to-paste --exclude.
Two corrections stand behind that screen, each added because its absence produced a wrong answer. Placement is not random, so the comparison is made within a single workload; without that control one machine looked twenty-five per cent worse than the fleet almost entirely because a defective campaign had landed there. And every row of the table is a hypothesis test, so testing each interval in isolation manufactures a culprit once the table is large enough: given twenty machines sharing one true failure rate, that procedure offered an innocent machine for exclusion in 54.8 per cent of tables, and in 77.8 per cent of forty-machine tables. A Benjamini-Hochberg correction across the rows holds the error near 2.7 per cent, and holds it flat as the table grows.
The accounting traps underneath
The sacct record is not a clean instrument. Each entry below was found on a real record, and each
corresponds to a regression test naming the job identifier that produced it.
| Trap | Reality |
|---|---|
ReqMem reads 0n on 2,130 of 6,574 jobs |
the real ceiling is in AllocTRES |
AllocTRES mem= is the allocation total |
--mem and the cgroup are per node, so a two-node --mem=8G job records mem=16G |
MaxRSS reports 51.25 GiB against a 40 GiB limit that killed the job |
it sums memory across the process tree, counting shared pages once per process |
MaxRSS differs by a factor of 4,000 between steps of one job |
take the maximum, not a step |
TotalCPU exists only on steps |
read it from .batch |
State=RUNNING, End=Unknown months after death |
elapsed time becomes now minus start; one such record was 65 per cent of a GPU-hour total |
sacct --state=X returns zero rows without -E |
always pass an end time |
Any quantity that cannot be read prints n/a and never 0. Field names, timestamp formats, host-list
syntax and the spelling of GPU resources all vary between scheduler versions and sites; each is
negotiated at run time rather than assumed, and each is covered by a portability test.
Three failures no single reading can reach
A memory request settled by trial and error
The clearest single case in the record is a tokenizer run over a corpus of source code. It was submitted ten times in one evening, and the memory request changed on almost every attempt.
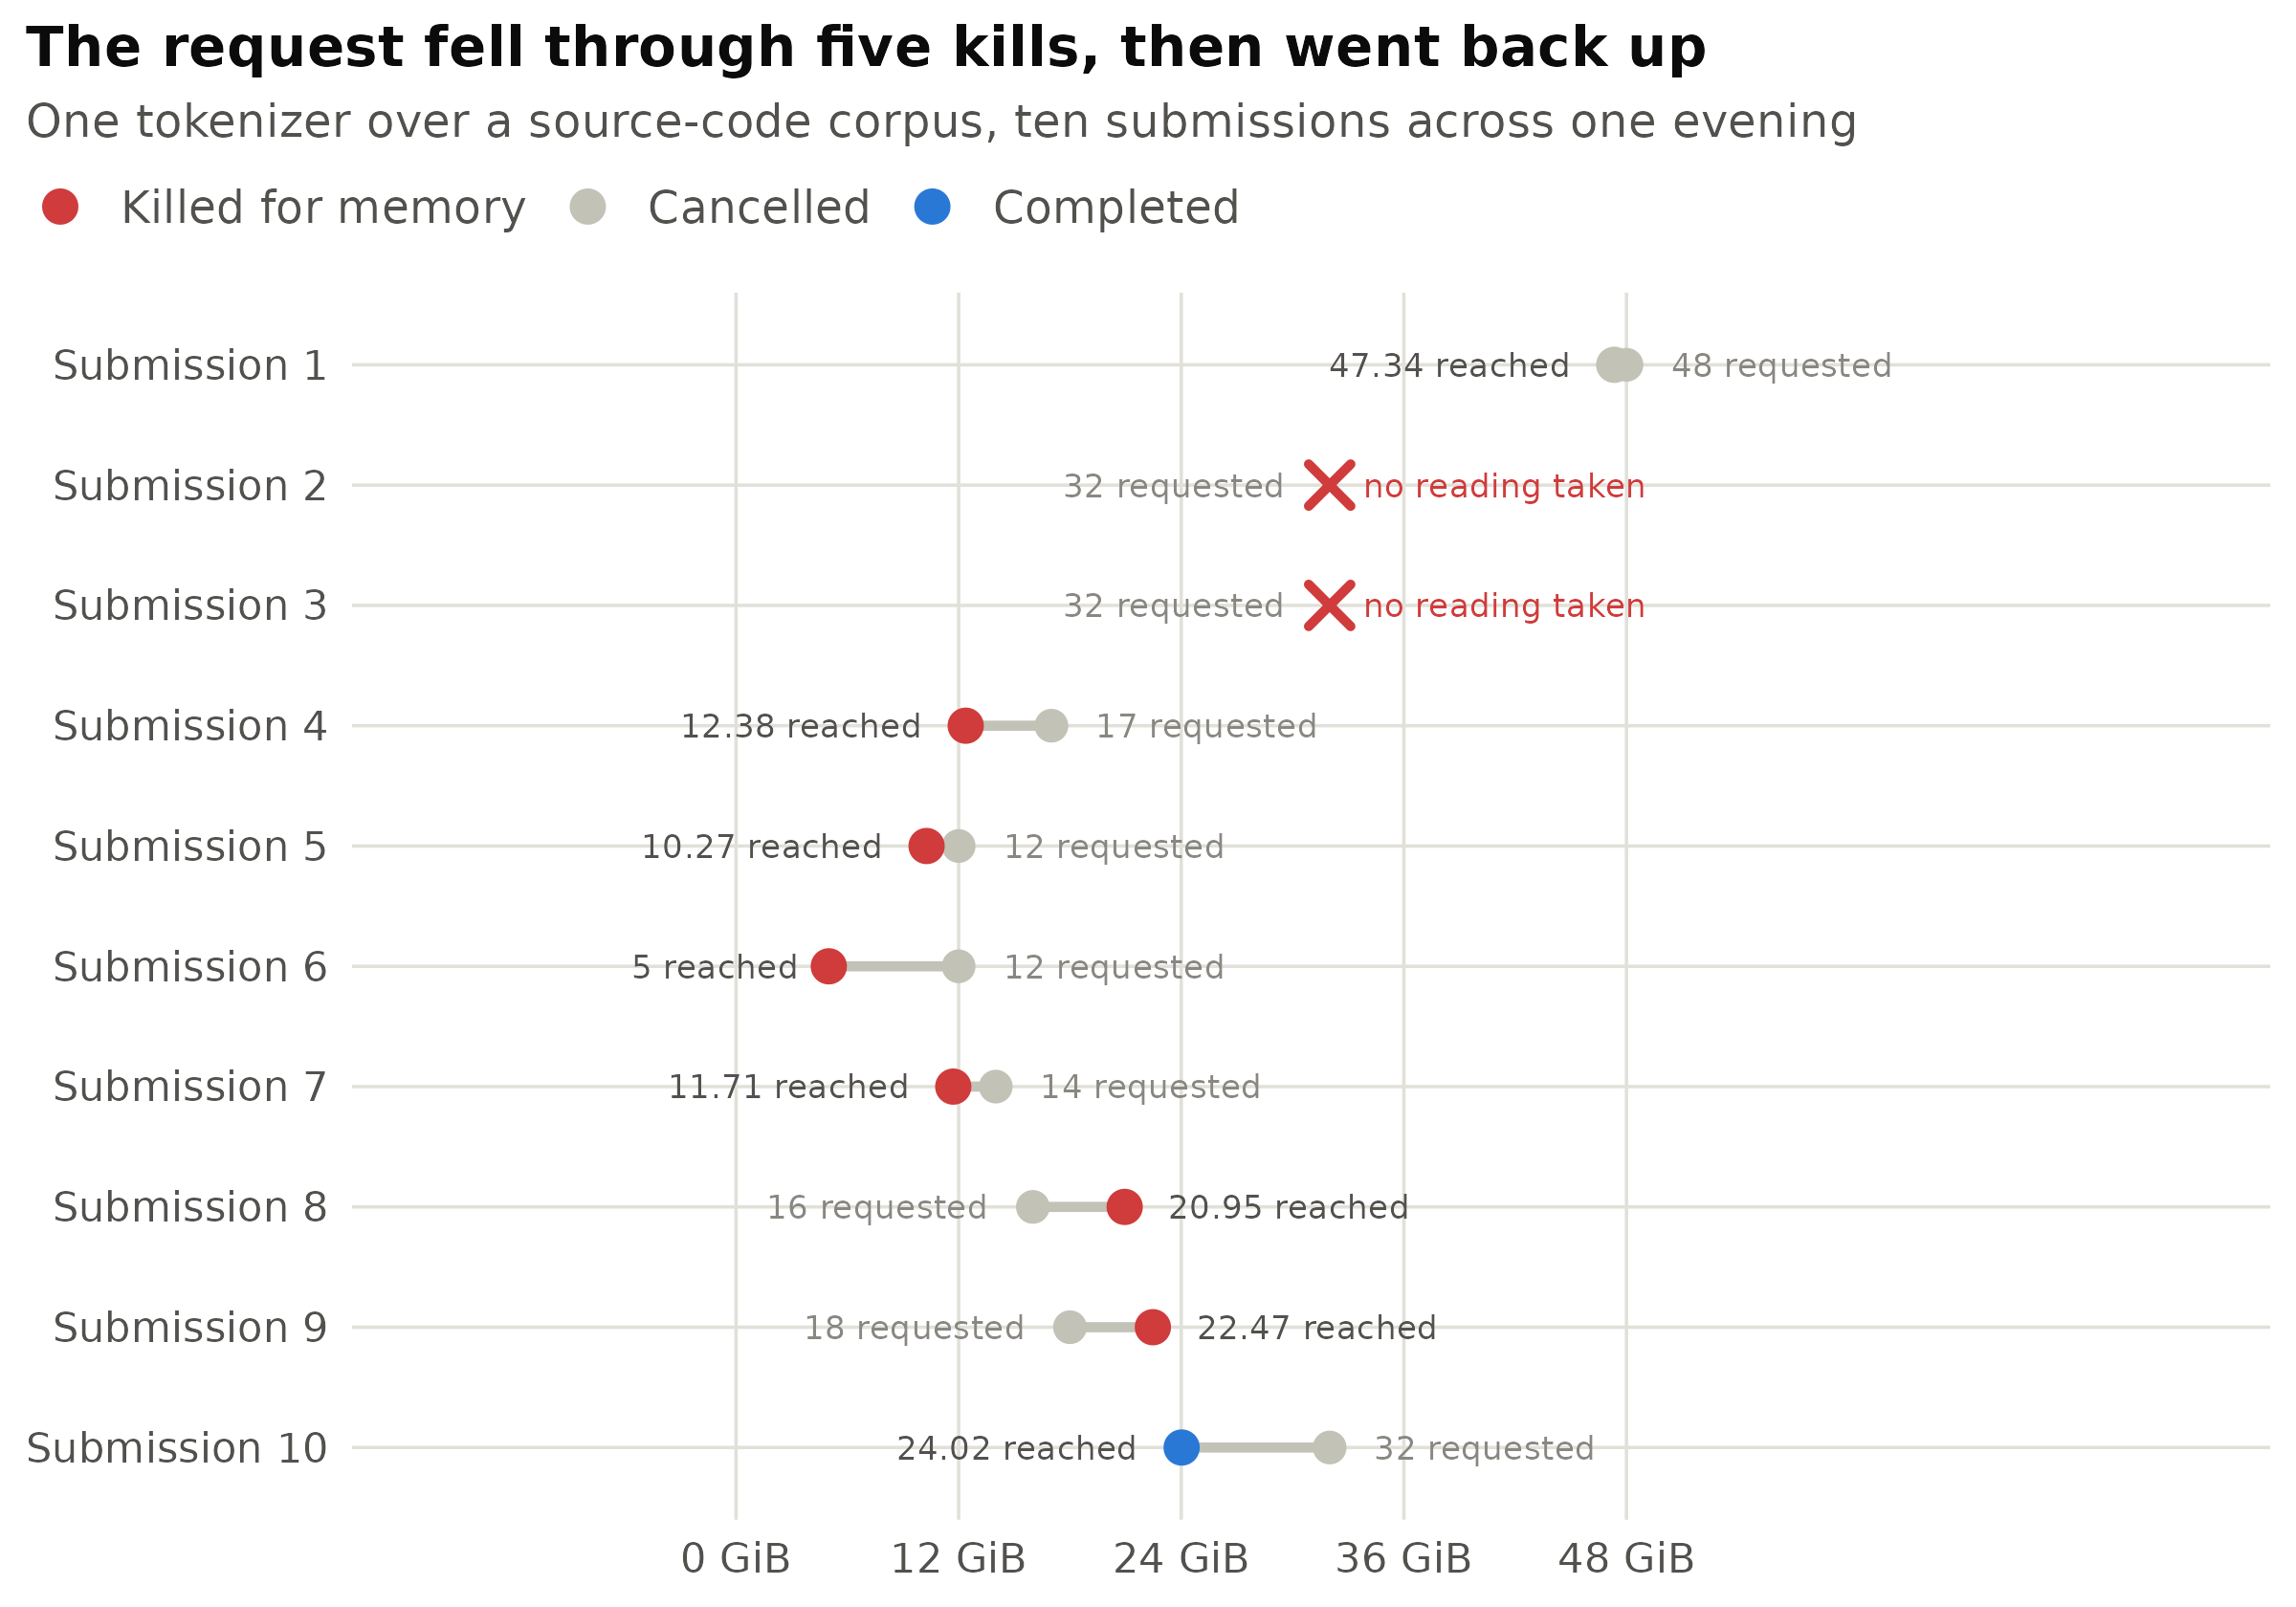
Figure 4: Ten submissions of one tokenizer, in the order they were made. The grey point is the memory requested; the coloured point is the highest figure the scheduler recorded for that run. Submissions two and three died before any figure was sampled. Where the coloured point lies to the right of the grey one, the run was killed while exceeding its limit.
Eight of the ten runs were killed for memory. The request descended from 48 GiB to 12 across the first six submissions while those kills were occurring, which is the opposite of the direction the evidence supported, then climbed back. The run that finally succeeded held 32 GiB, a value already killed twice at the start of the evening, and reached 24. Something other than the memory request was the deciding variable throughout, which is precisely the conclusion the cross-run check draws and the reason it refuses to recommend a further increment.
The sequence occupied a sixteen-core allocation for one hour of compute and nine hours of wall clock. Every fact required to stop after the third attempt was in the accounting database by then.
An array sized from two unrepresentative tasks
The second case is the more interesting of the two, because it is the failure mode of following the earlier article’s advice correctly.
A campaign scanned a text corpus in 142 shards, one array task per shard. Two single-task probes were
run first; they reached 1.00 and 0.72 GiB against an 8 GiB request. Sized against those readings, the
full array was submitted at --mem=6G, and 71 of the 142 tasks were killed for memory.
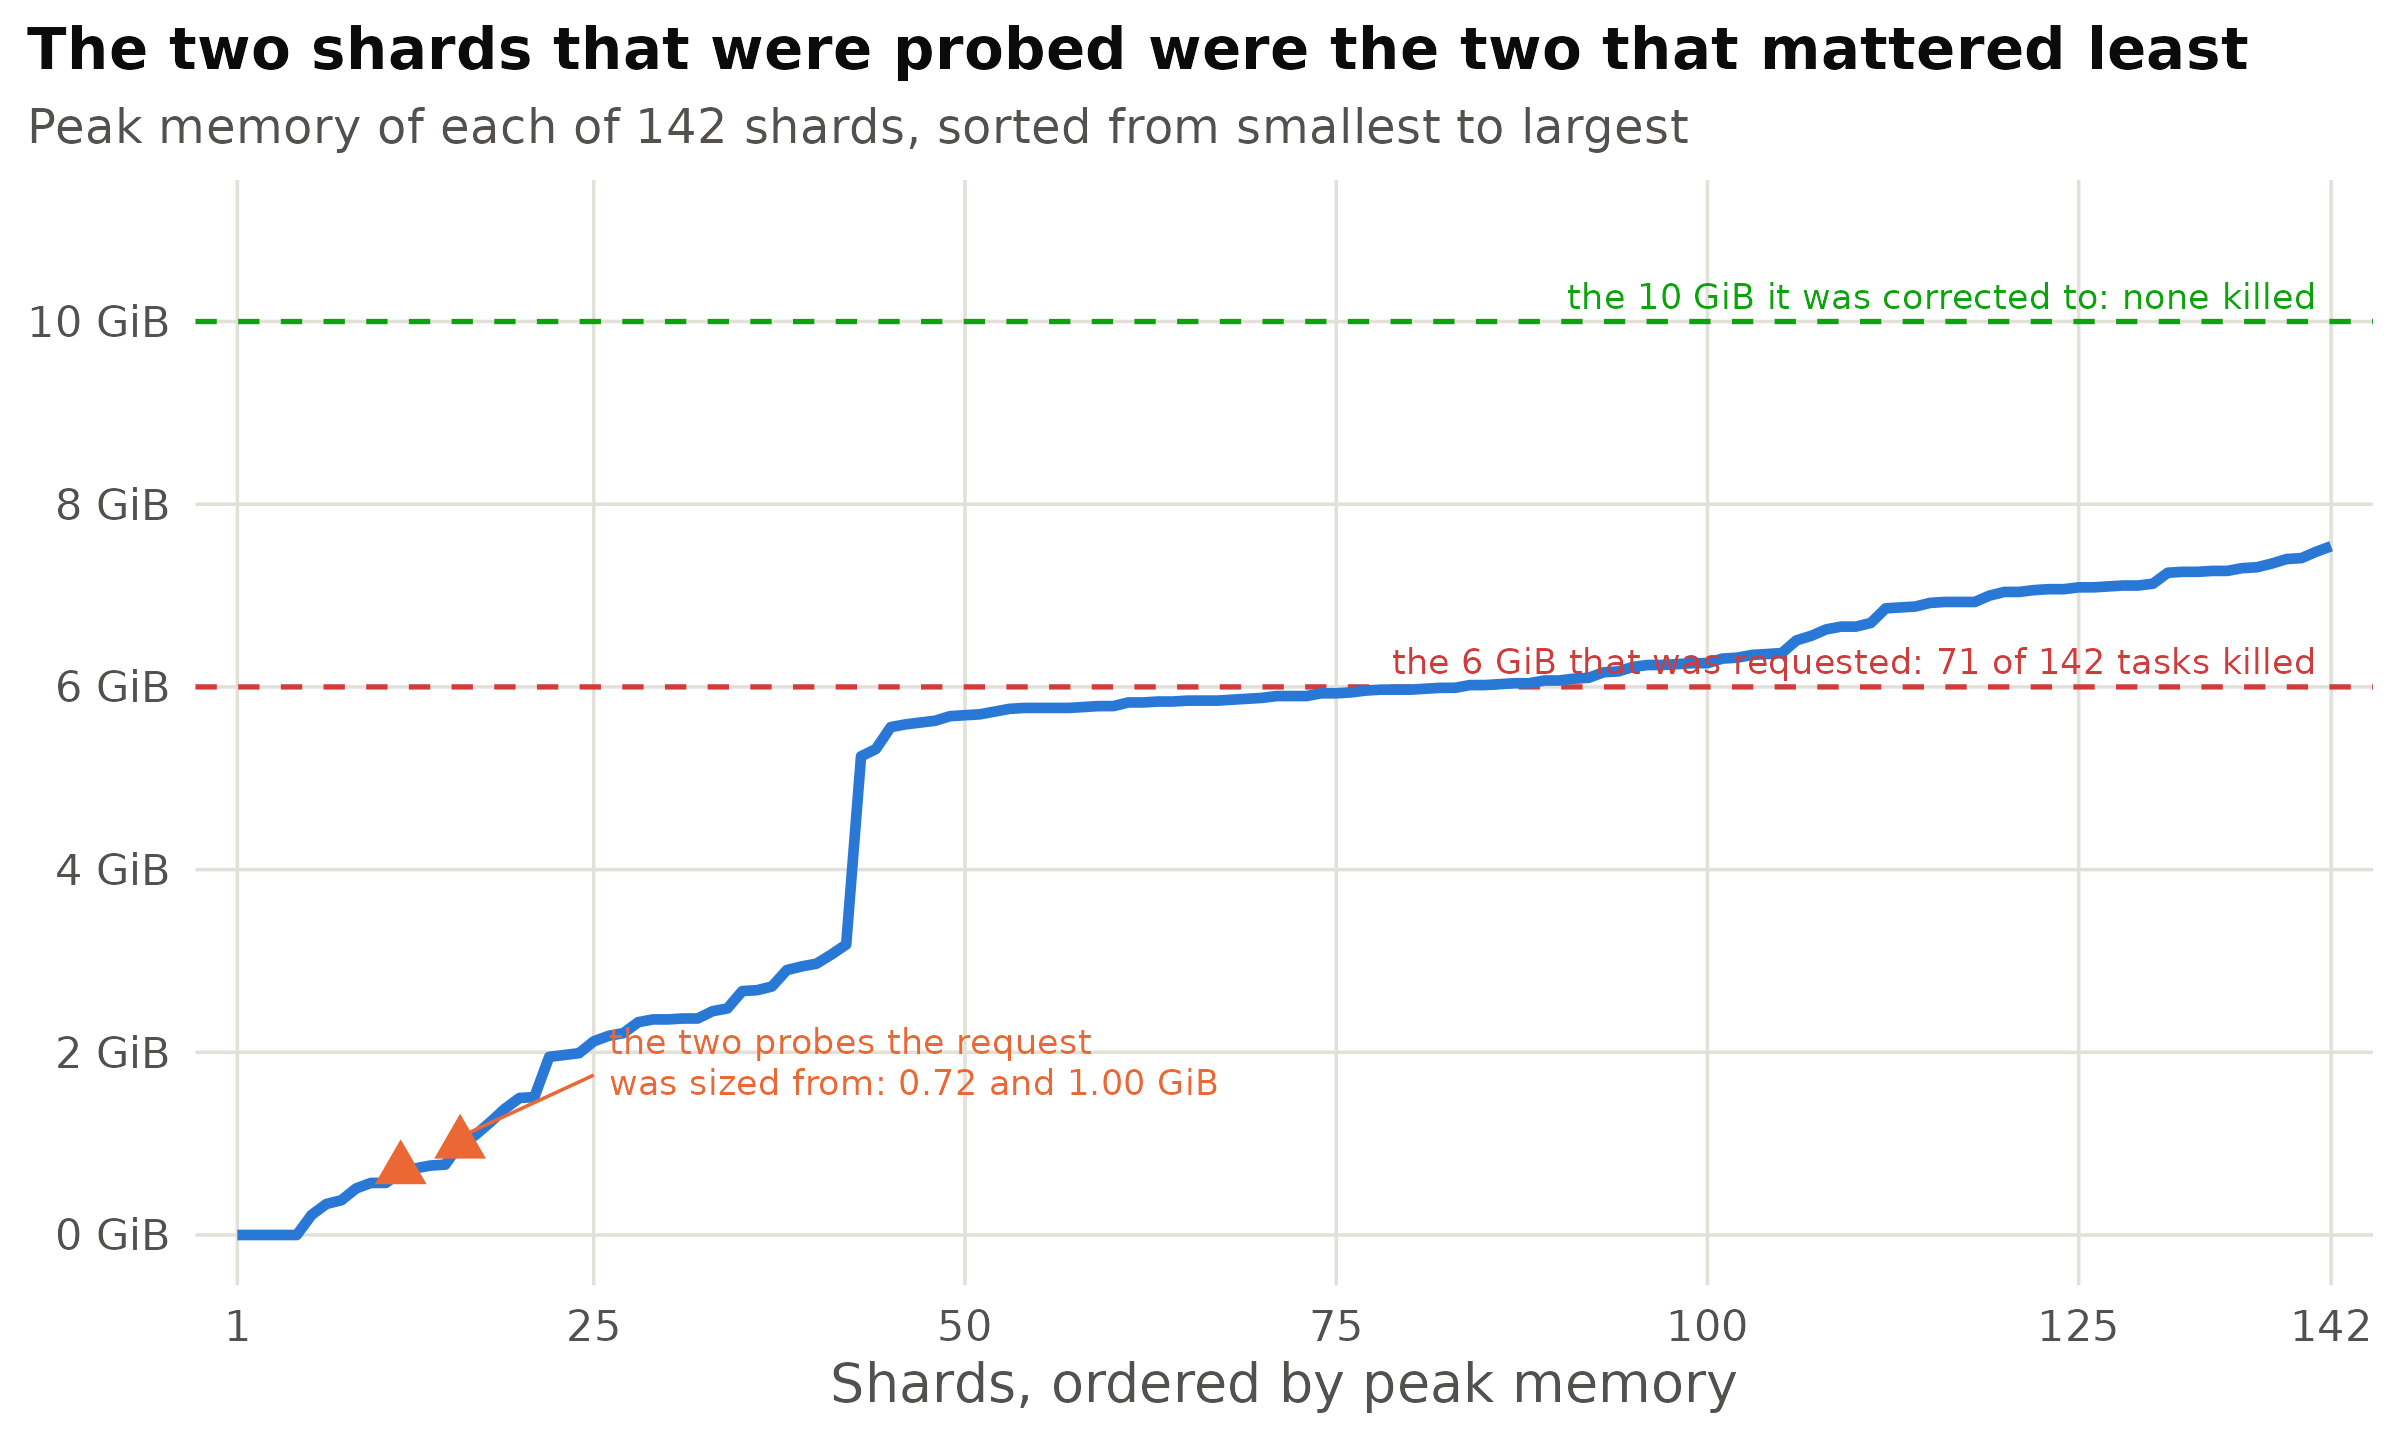
Figure 5: Per-task peak memory for all 142 shards, sorted from smallest to largest, taken from the corrected rerun so that no measurement is truncated by a kill. The two probes the request had been sized from are marked at their position in that order: both fall inside the smallest fifth of the corpus. Fifty-nine shards exceed 6 GiB here, while 71 were actually killed at that request, because a peak sampled every few seconds understates a brief spike.
Thirty-seven hours of task time were destroyed and recovered within forty-one minutes, which is an inexpensive version of this mistake. The general point is that a live reading measures the run that was watched. Where the work is one long job, that is the same thing as measuring the workload, and it is why the earlier article’s remedy succeeded on training runs. Where the work is an array over heterogeneous input, or a pipeline whose phases differ in footprint, one reading is a sample of size one, while the quantity that decides survival is the maximum over the whole population.
Repetition under an unchanged request
Across the whole record, 71 workloads ran at least five times and failed at least three. In 40 of them every failing run used an identical memory request and an identical time limit.
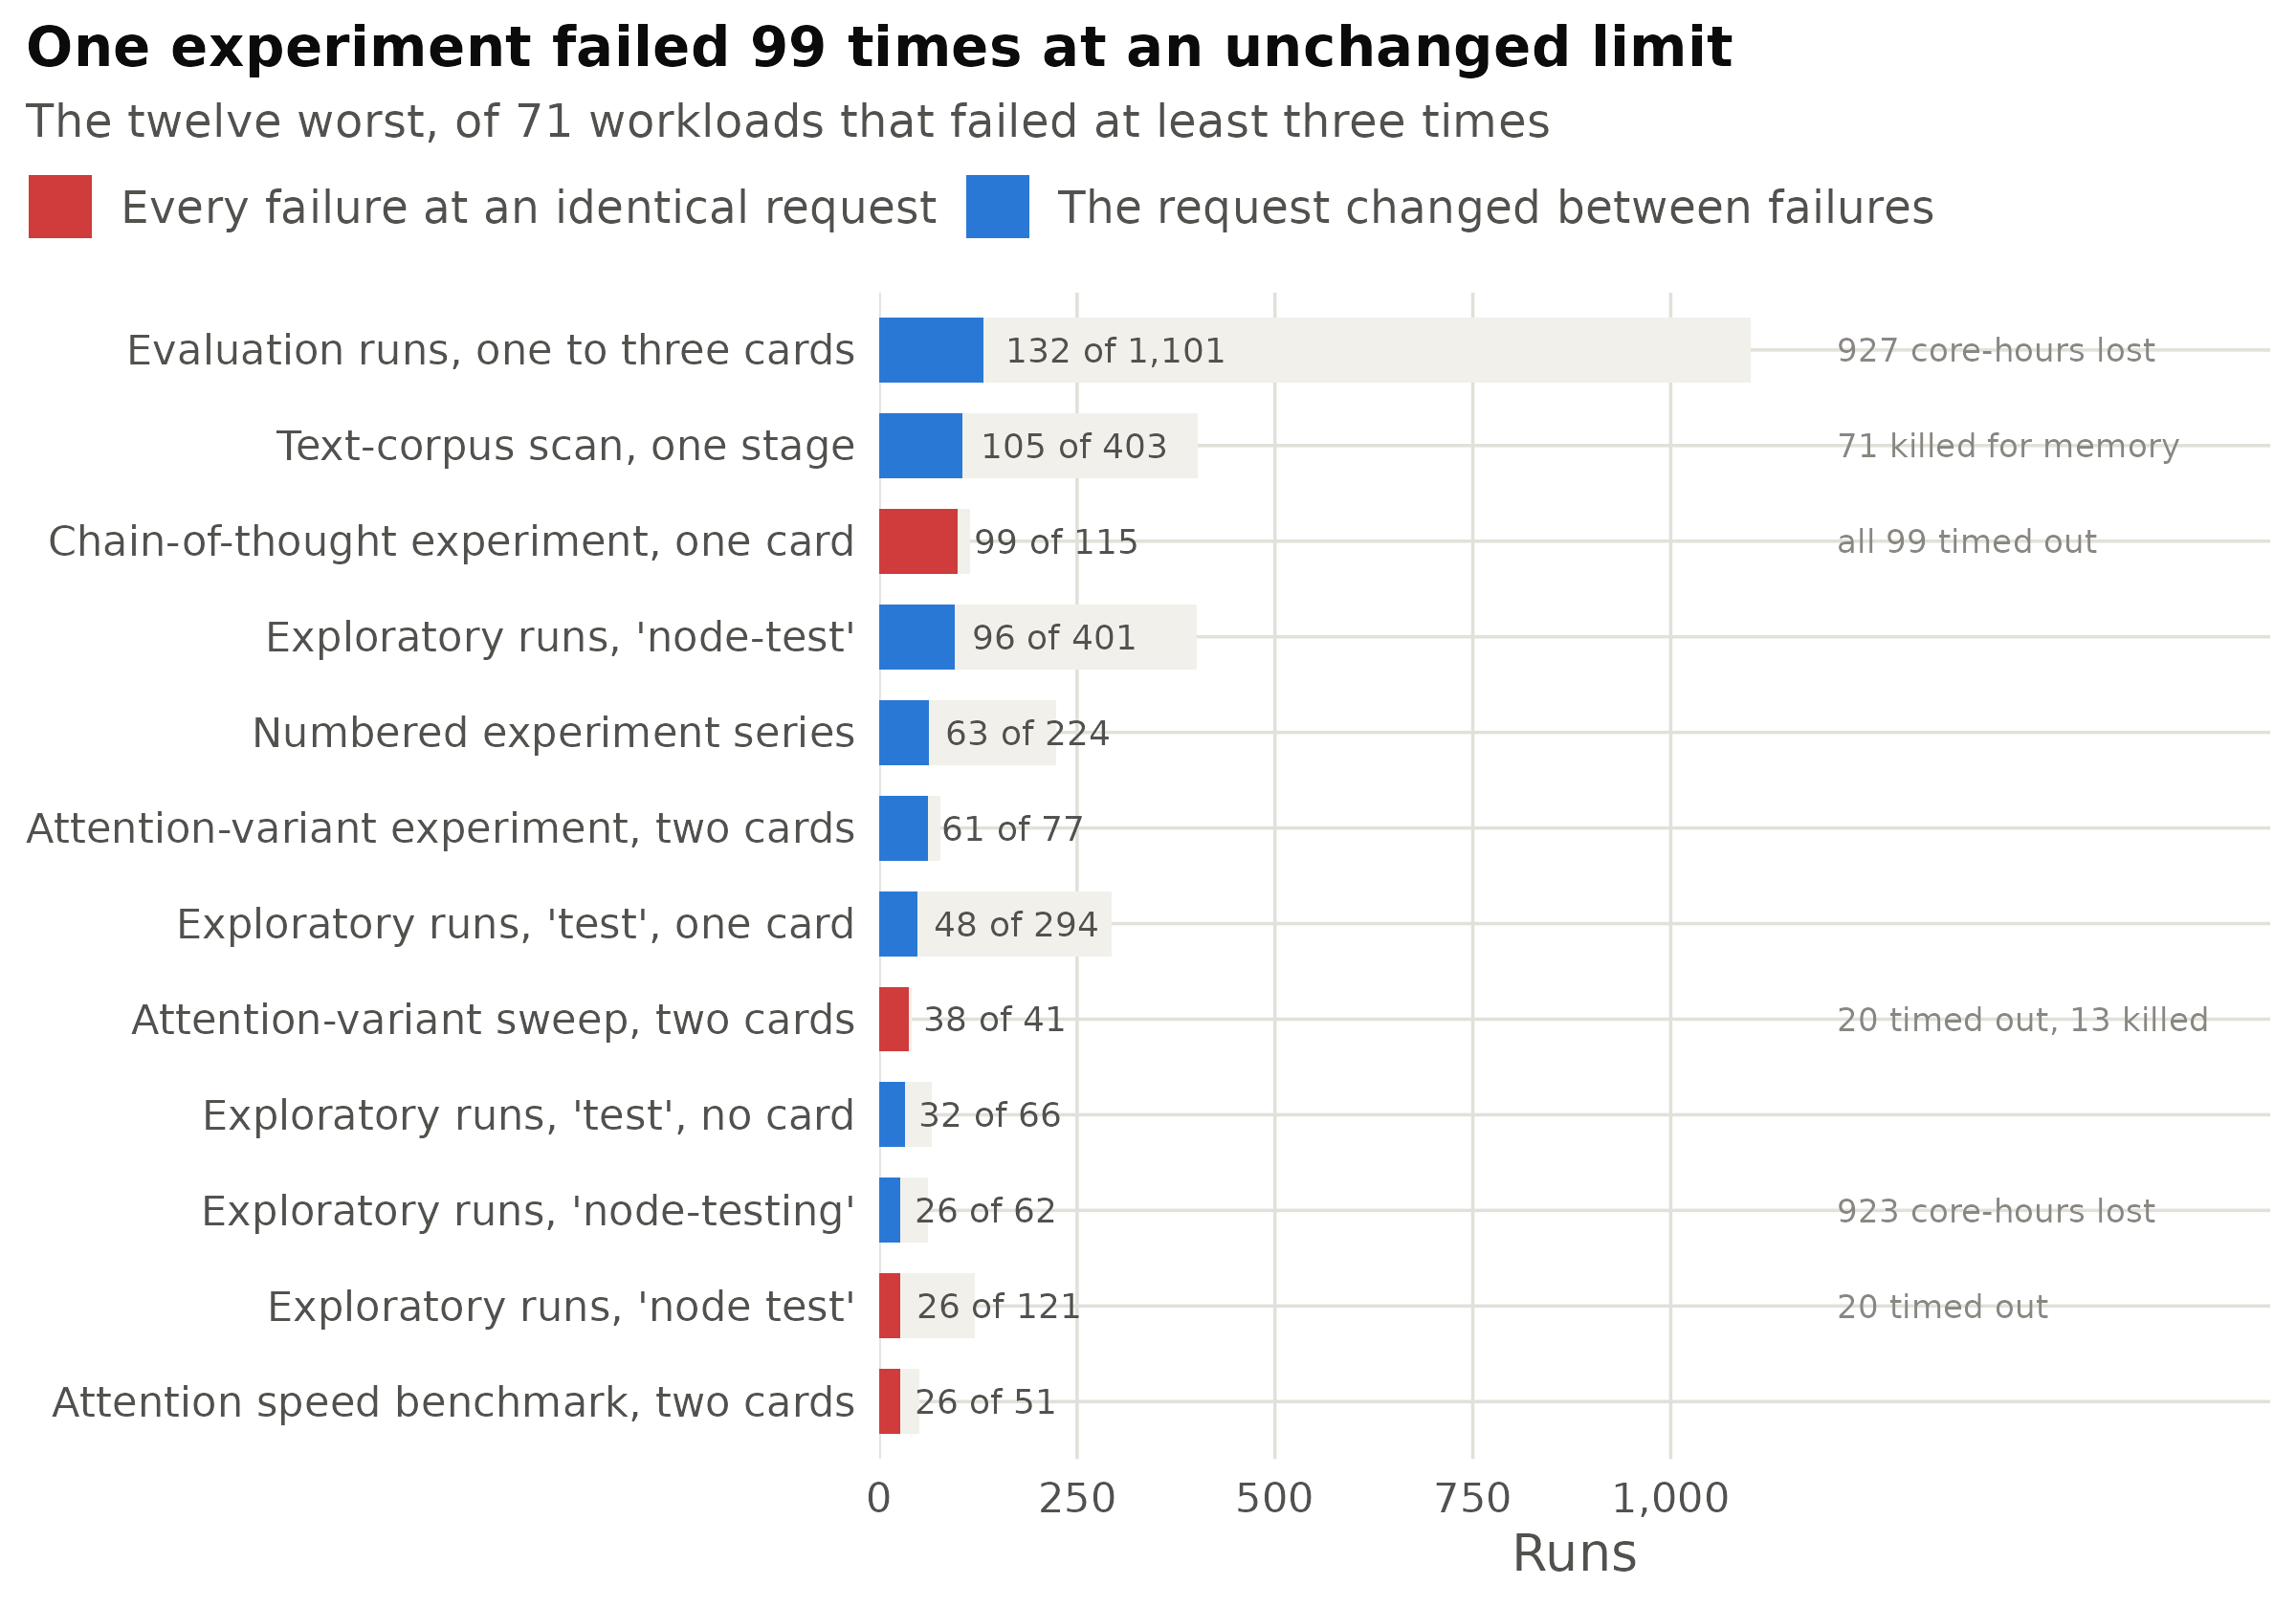
Figure 6: The twelve workloads with the most failures. Each is named by the name its own submission carried, since that is what the record supports: five of the twelve are exploratory runs called some variant of ‘test’, which fail often and are expected to. The faint bar is every run; the solid bar is the runs that failed. Red marks a workload in which every failing run carried an identical memory request and an identical time limit, so the request was never varied in response to the failures.
The reasoning experiment in the third row is the case the check was written for. Its 99 timeouts consumed 300 core-hours and 50 GPU-hours, every one of them at the same thirty-minute limit, and the verdict the tool returns is not “raise the limit”. The timed-out runs consumed almost no processor time before reaching the wall, which means they were blocked rather than slow, and a longer limit purchases a longer hang. That distinction requires both numbers together, and it is the difference between diagnosing the failure and paying for it a hundredth time.
Taken across all 71 workloads, the failures under an unchanged request account for 458 of the 1,206 failed runs.
The verdicts the record produces
Applying the sizing engine to every workload attributable to Claude Code produces a verdict per flag, or an explicit refusal where fewer than three runs support one.
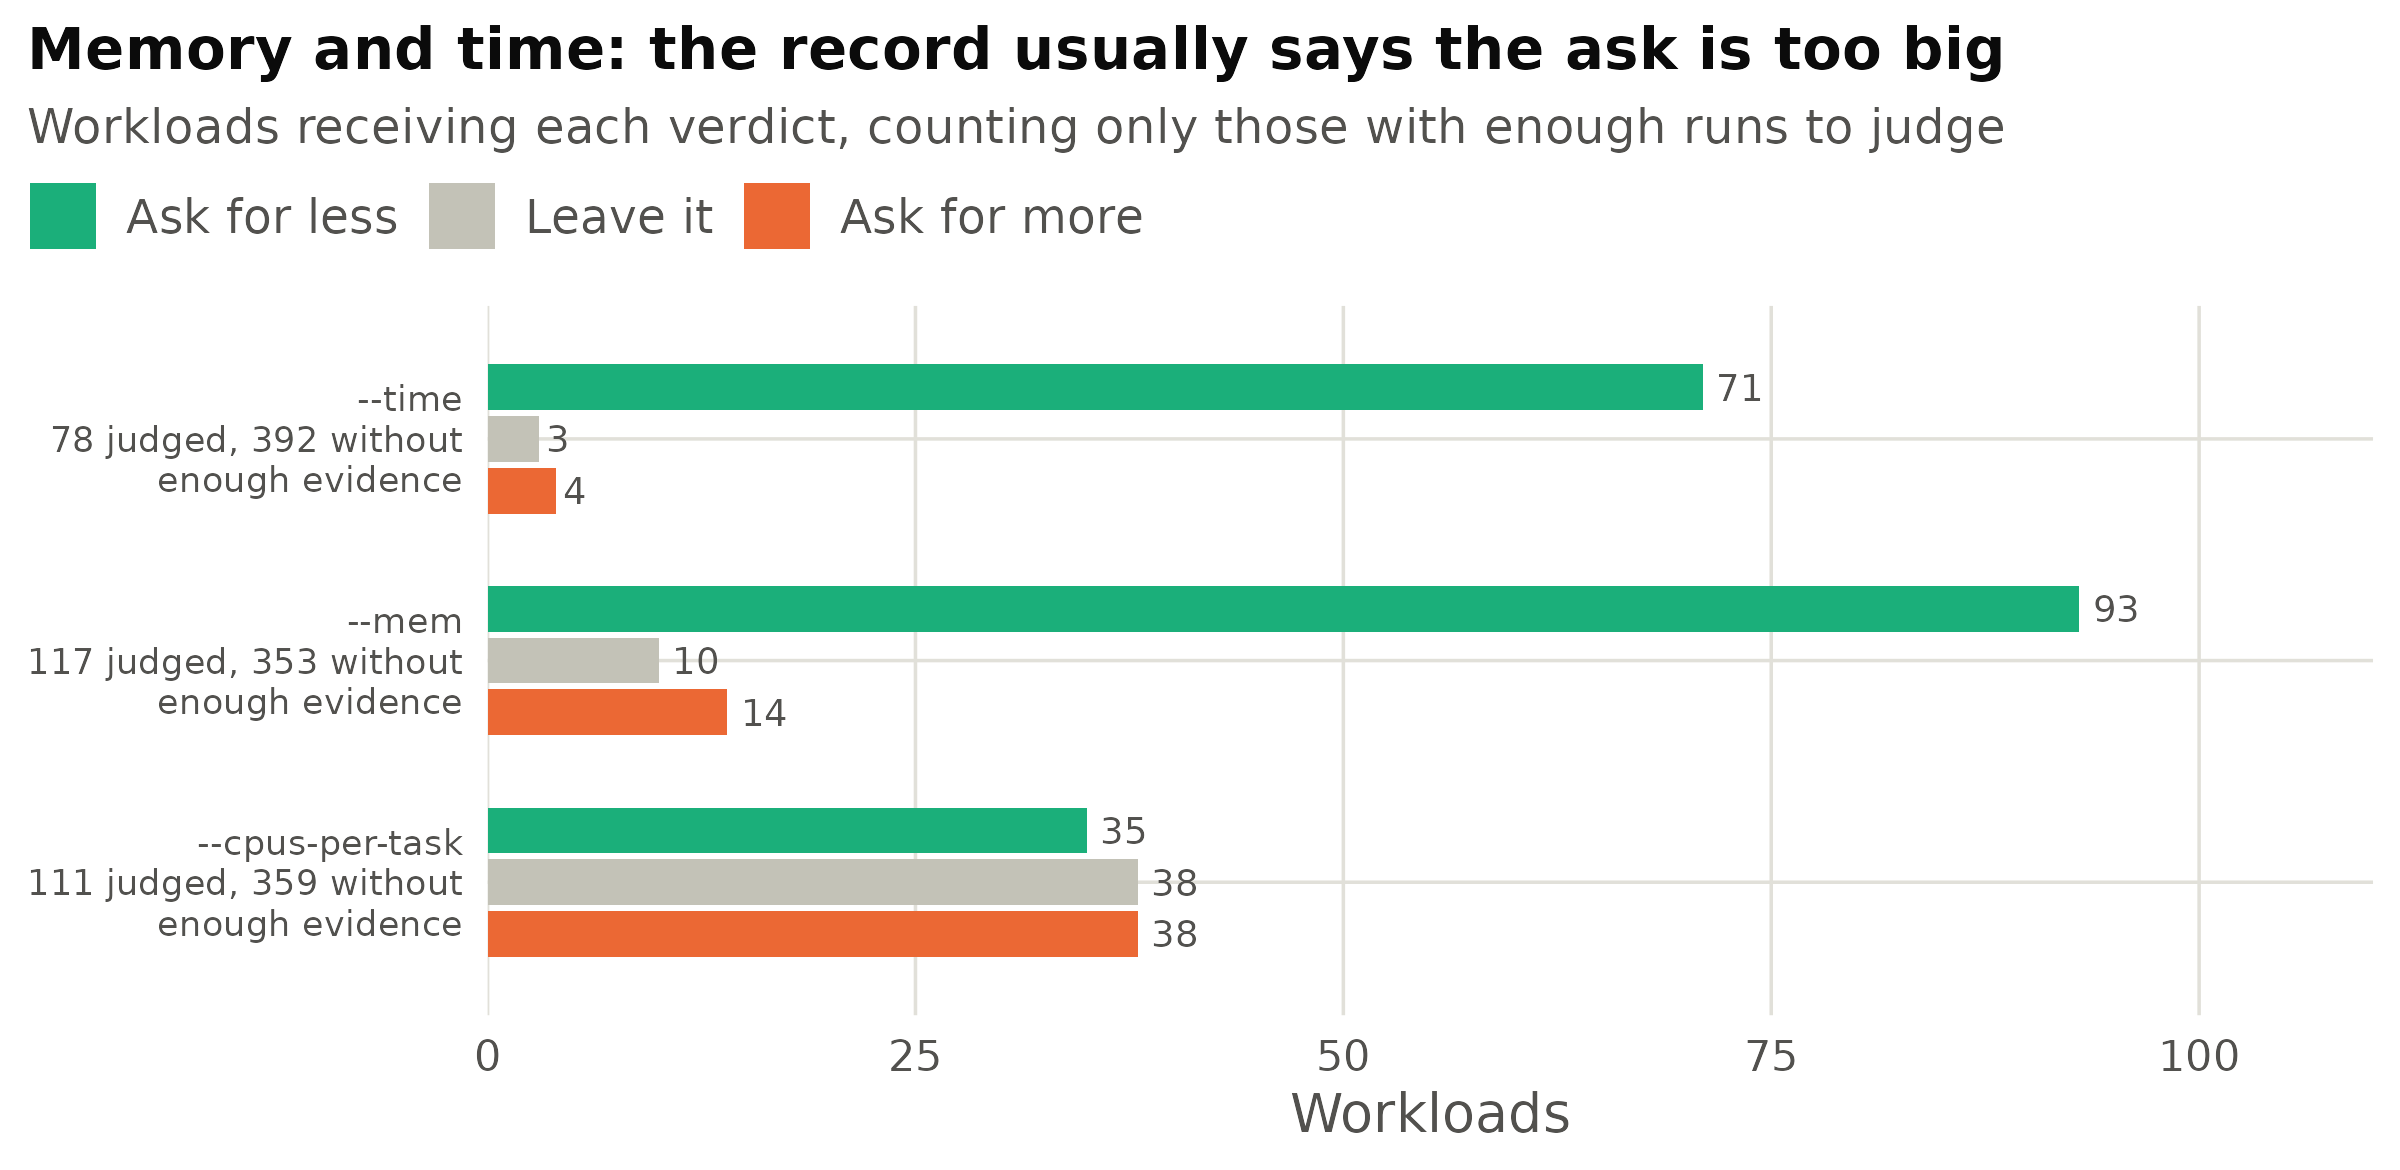
Figure 7: Verdicts over the 470 workloads. The refusals are excluded from the bars and counted in the axis labels instead: most workloads in any real history are run once or twice, and three usable runs are required before a verdict is offered.
The processor row does not follow the pattern: it recommends an increase as often as a reduction. Most of those increases are single-core tasks that kept their one core saturated, and a saturated resource is evidence that more of it might help. On this history the recommendation is nonetheless frequently wrong, for a reason taken up under limitations.
The individual memory verdicts, for the workloads that consumed the most compute, are below.
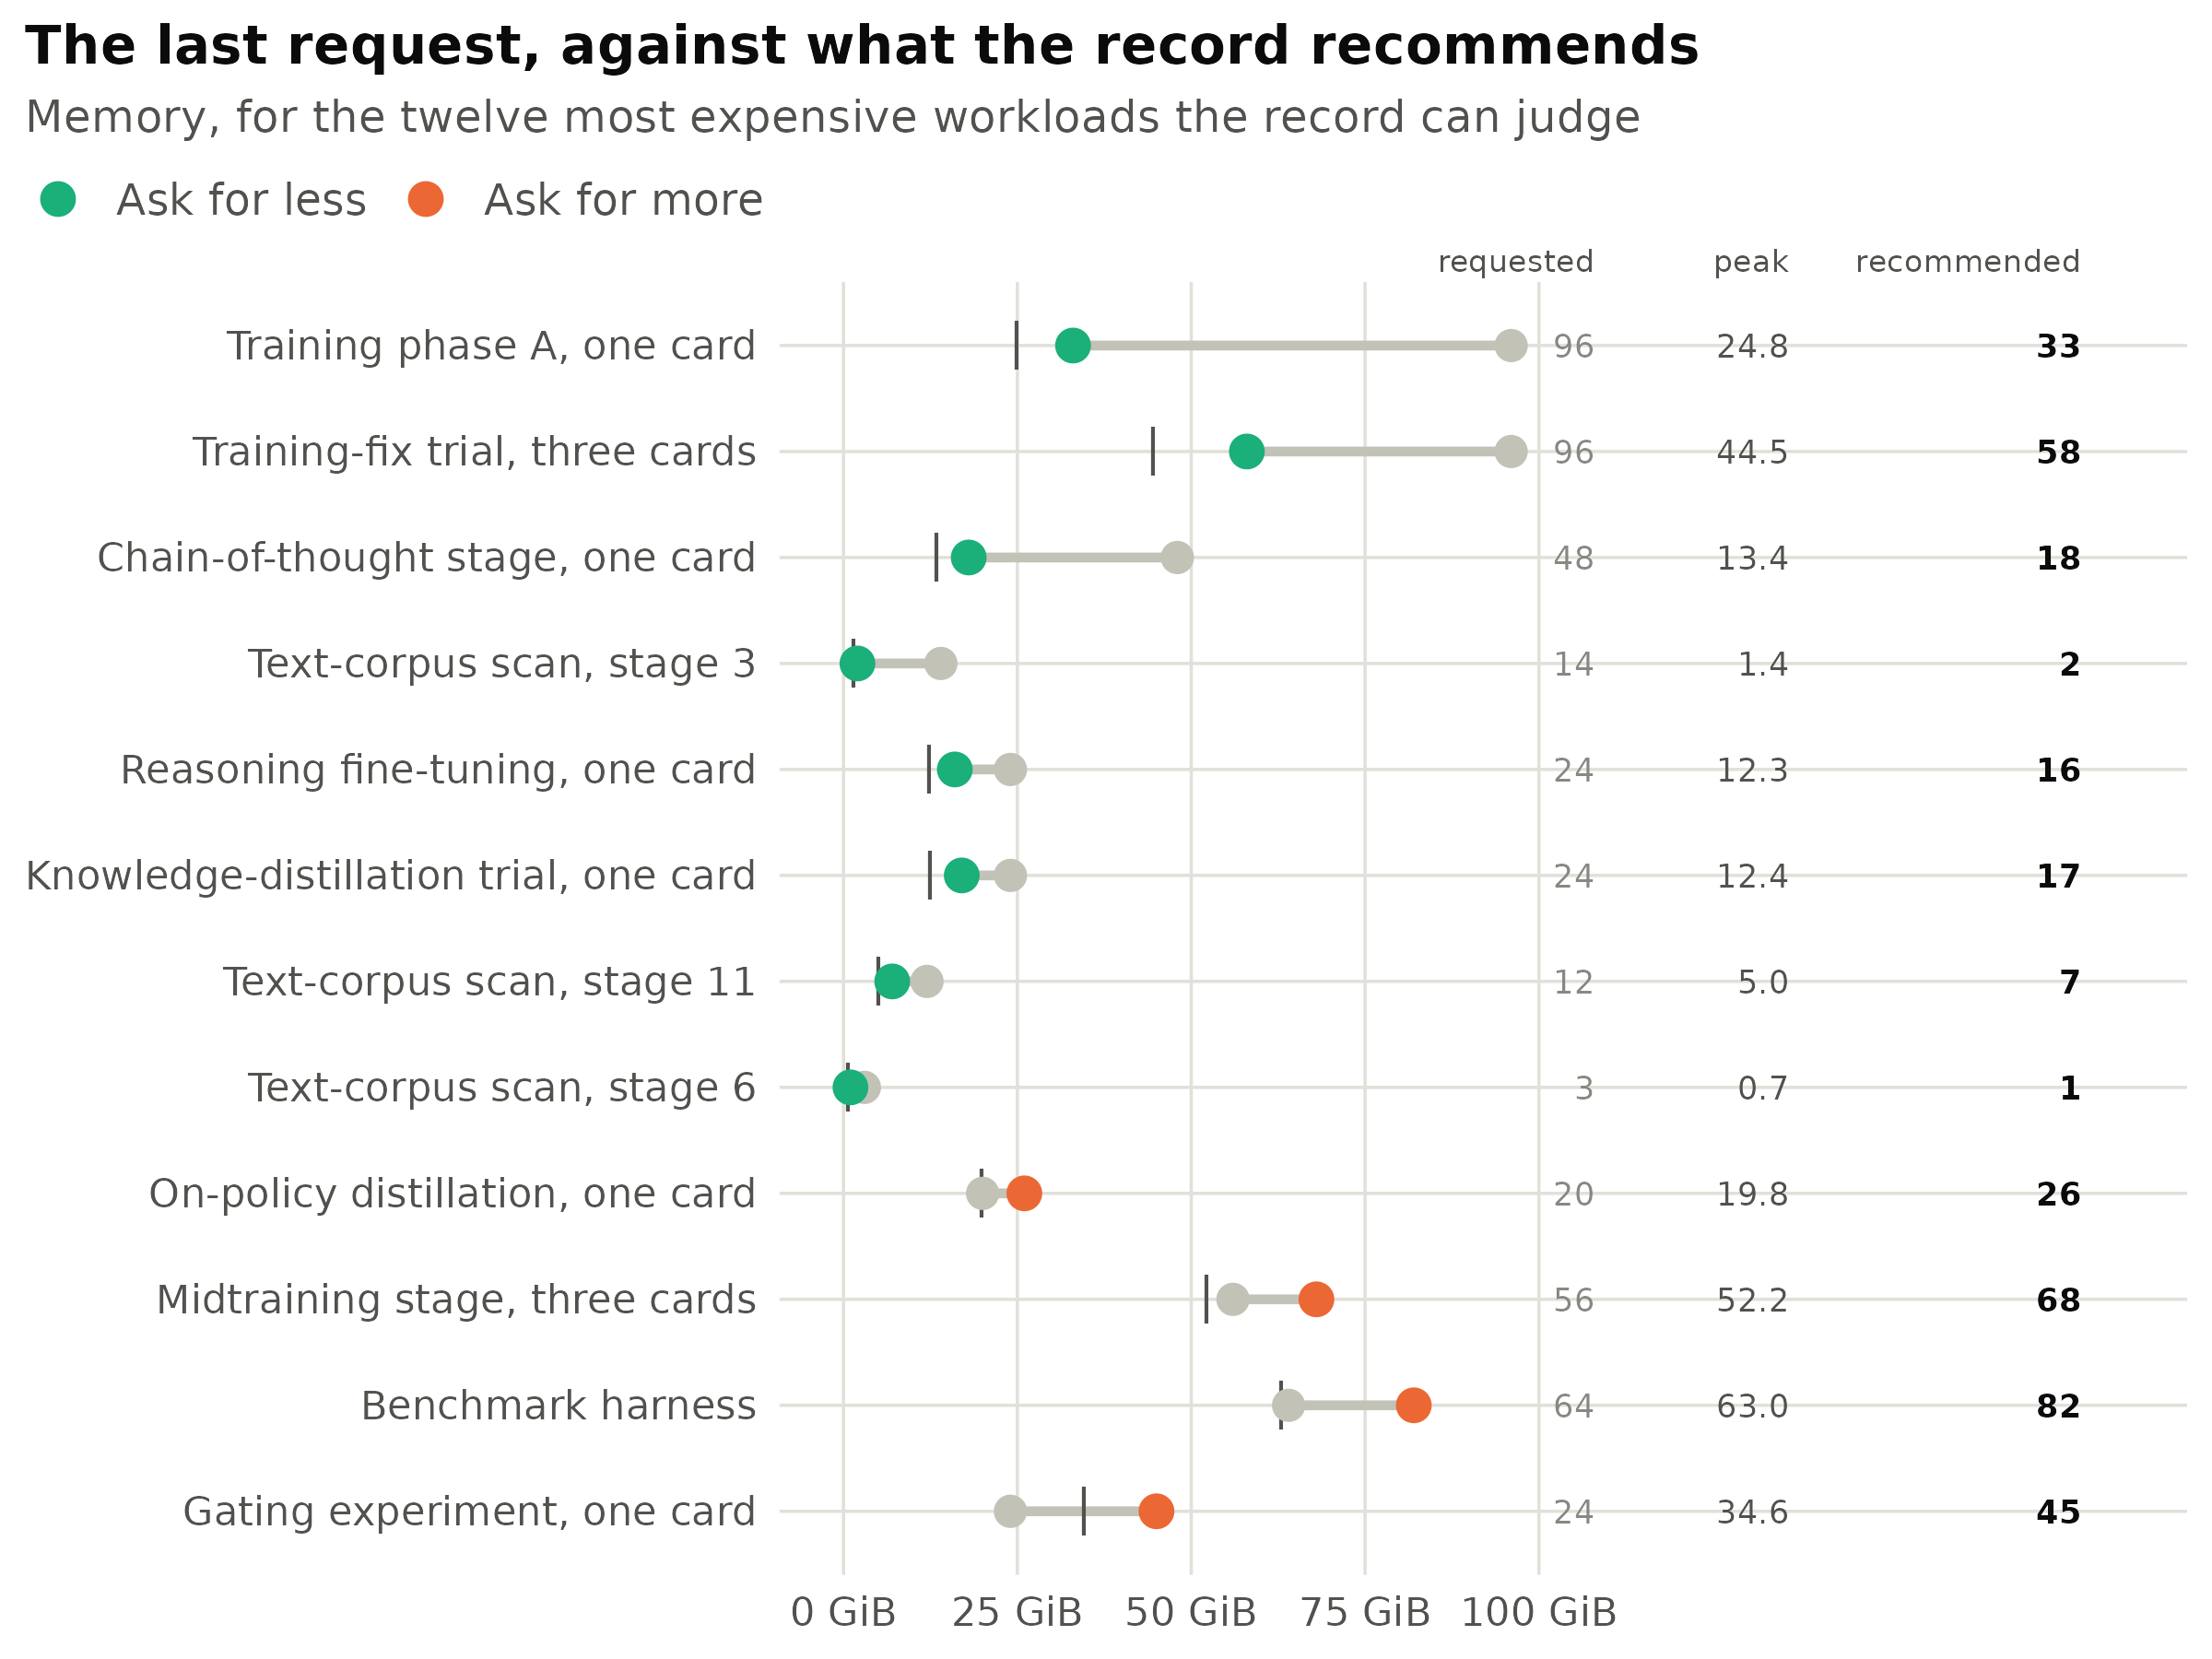
Figure 8: The twelve most expensive workloads for which the record produces a memory verdict. The grey point is what the most recent run requested; the coloured point is what the record recommends. The vertical tick, and the middle number column, are the largest figure ever recorded for that workload. That is the quantity the recommendation is derived from, with a thirty per cent margin added.
The four increases are the valuable part of that figure and the part no cost-minimising rule would produce. In the gating experiment, the most recent run requested 24 GiB for work that had already reached 34.56 in an earlier run. The time limit produces two more of the same kind, not shown above: a family of experiments whose recent runs requested thirty-five minutes, where the longest completed run of that same work took four hours and ten minutes; and a pretraining slice whose longest completed run finished one minute and sixteen seconds inside an eight-hour limit. Neither had failed at the point the record was read.
The value of acting on them
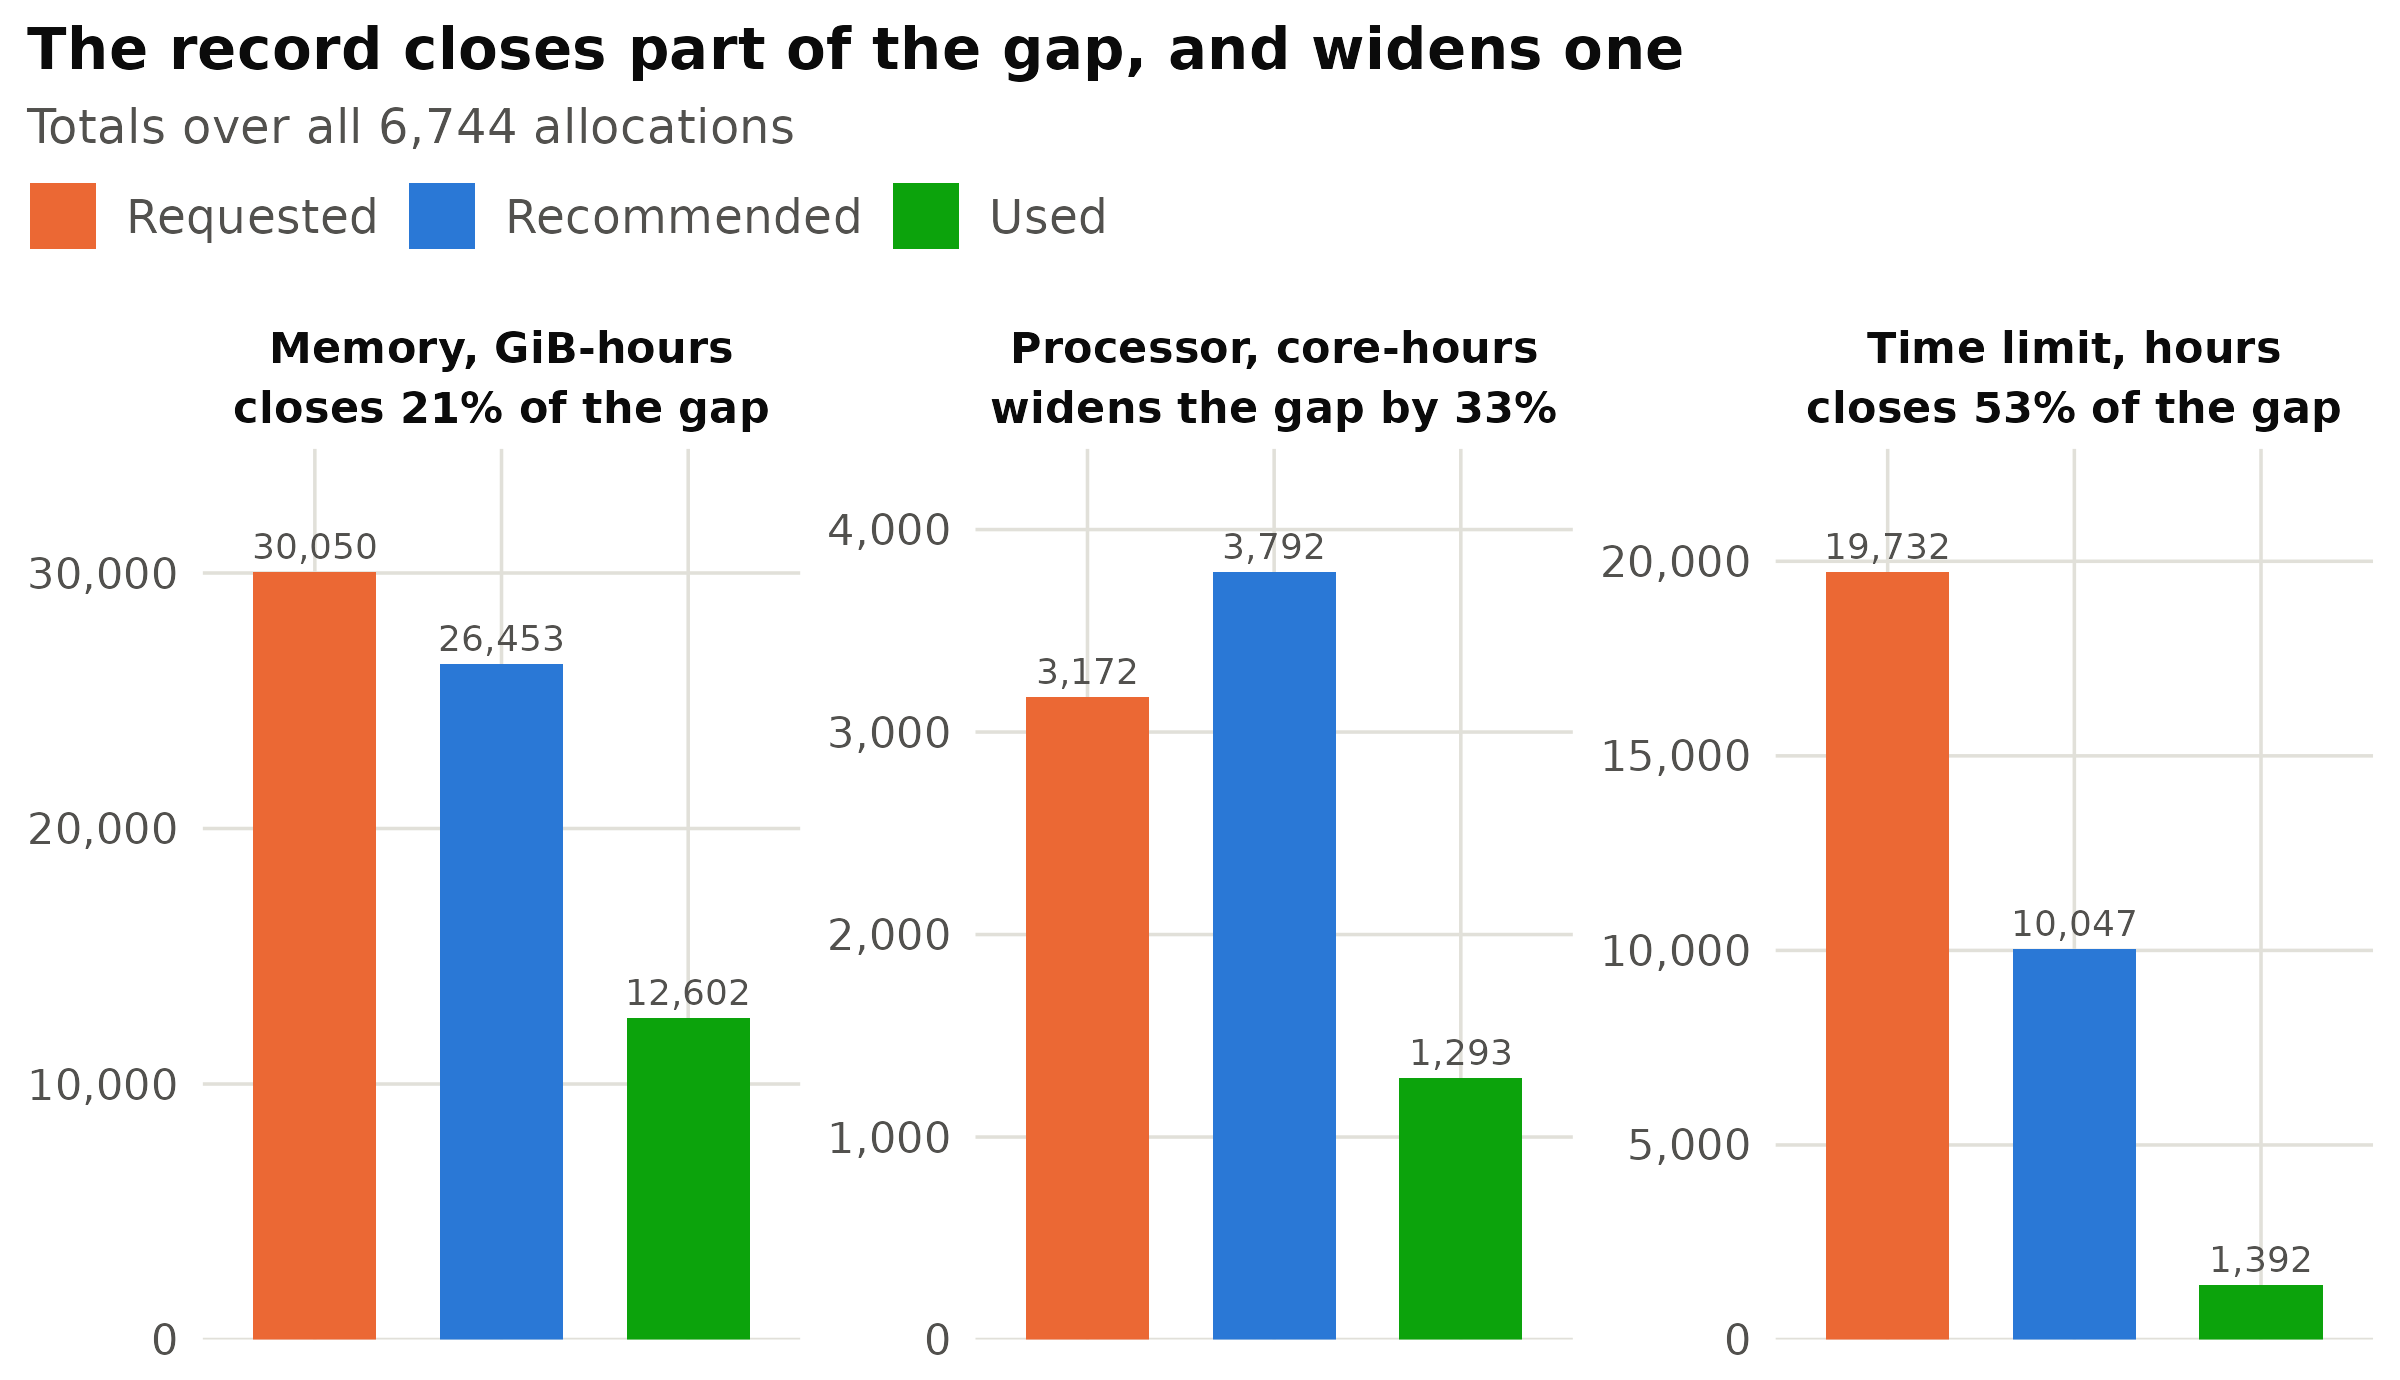
Figure 9: Every allocation attributable to Claude Code, re-costed under the request its own history recommends. ‘Used’ is what the runs consumed: recorded peak memory held for the duration, processor time actually burned, and wall clock actually elapsed. Memory usage here rests on MaxRSS and is therefore an upper bound, so the true gap in the first panel is wider than shown.
Three readings, and the second is the honest limit of this whole approach.
The time limit collapses, because a completed run’s duration is an exact measurement and the recommendation is that duration plus a quarter. An over-long limit costs queue position rather than capacity, so it is the cheapest of the three to get wrong, and the one the record settles outright.
Memory closes about a fifth of its gap, because the recommendation adds a thirty per cent margin to
MaxRSS, a figure that already reads high. It is systematically generous, and deliberately so: a
memory recommendation that is too small destroys a run. The remaining four fifths is exactly the
territory a live reading of the working set reaches and the record cannot. The two instruments are not
substitutes.
Processor time moves the wrong way, by a fifth, because of the single-core increases. Accepting only the recommendations that reduce a request turns that into a 4.9 per cent saving.
Allocations that held a card and computed nothing
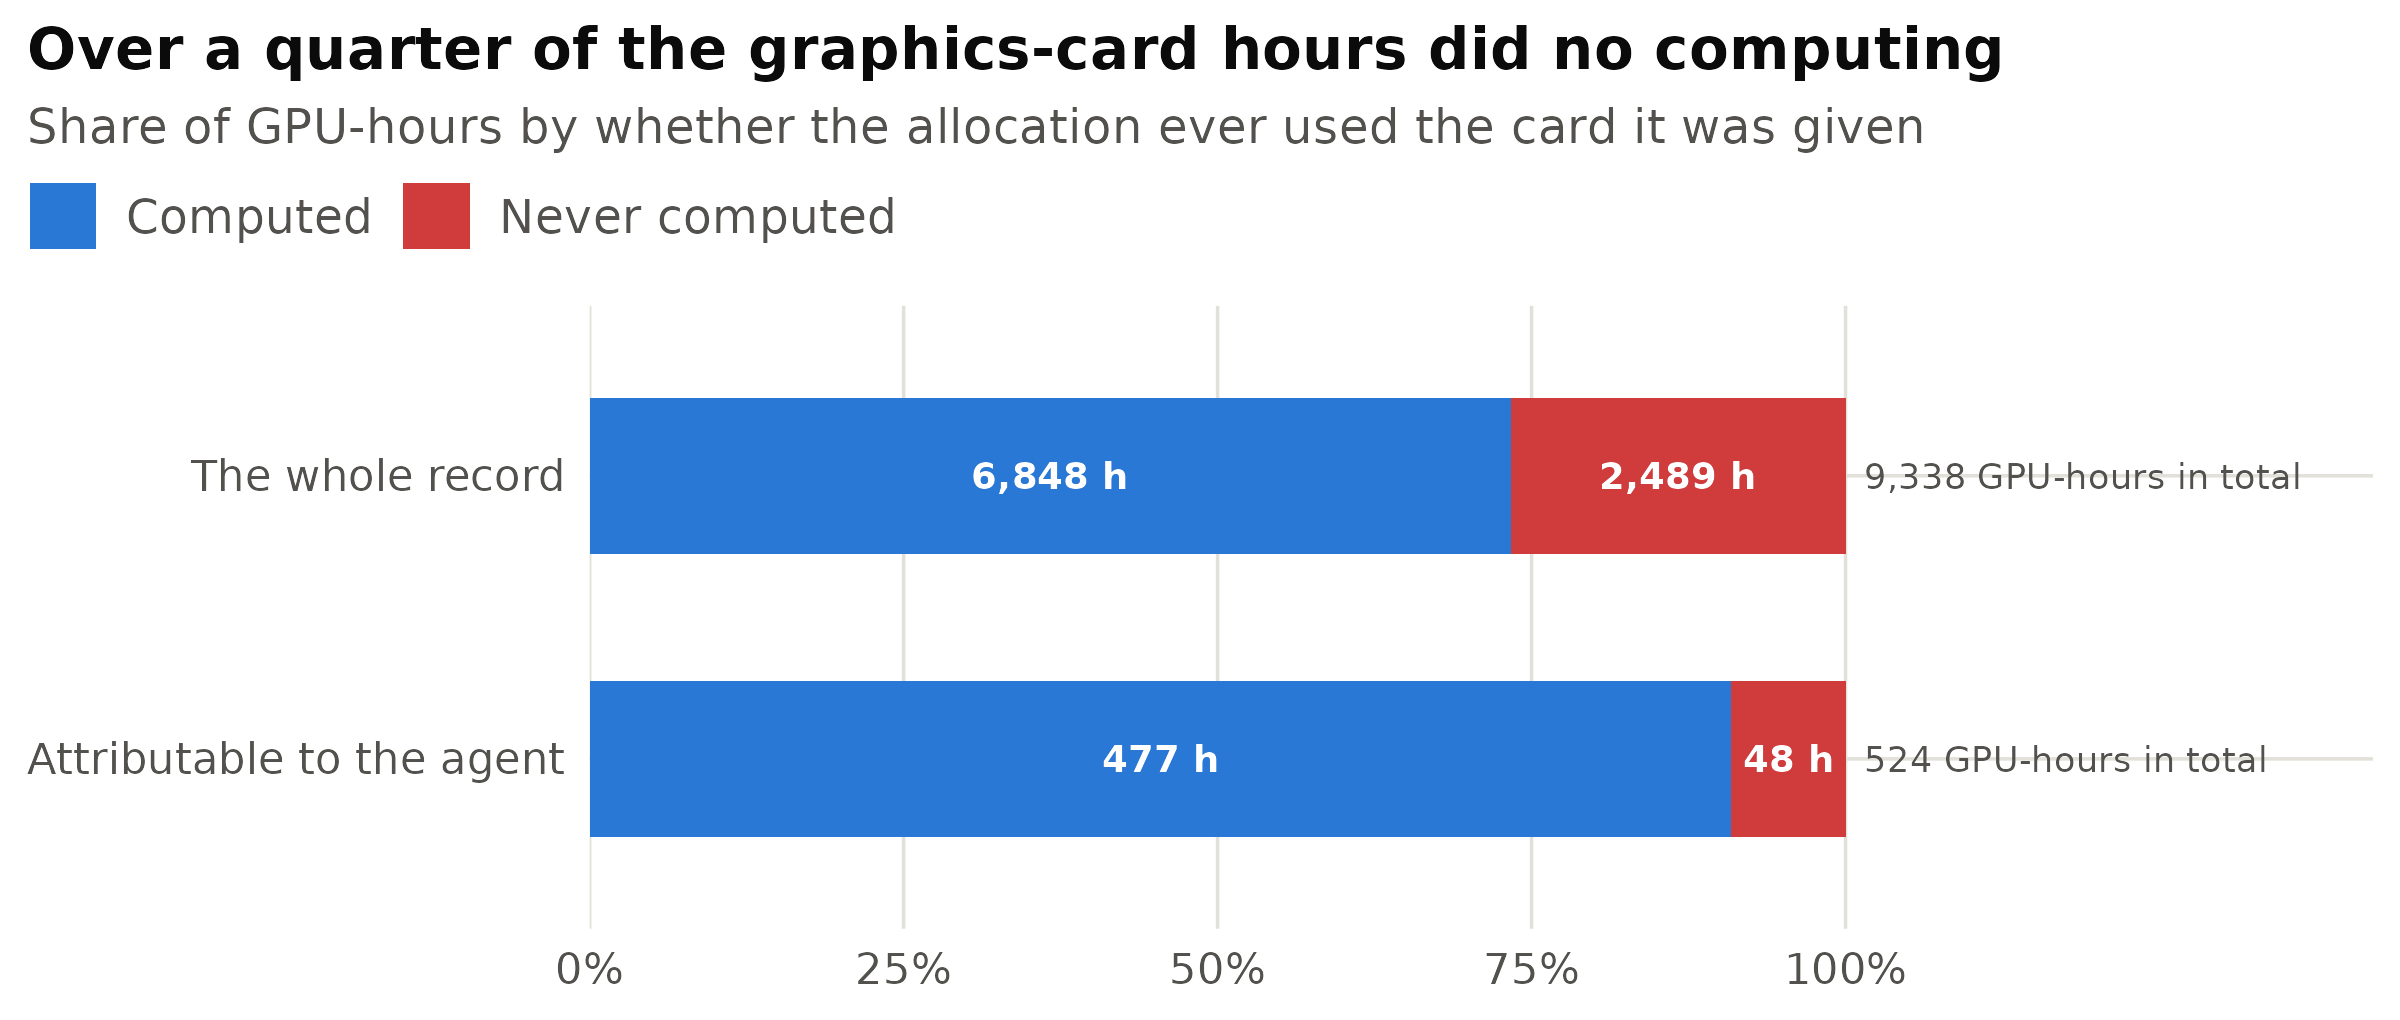
Figure 10: An allocation counts as having computed nothing when it held its resources for the whole of its life while consuming essentially no processor time. A cancelled run that had already performed useful work does not qualify. The two rows are drawn as shares because the record as a whole holds eighteen times the graphics-card hours of the attributable portion; the hours themselves are printed inside the bars.
This is a post-mortem finding by construction. Nothing distinguishes a hung allocation from a working one at the time unless somebody looks; afterwards it is unmistakable, because the record shows hours of wall clock beside a processor total of a few seconds. The attributable portion performs considerably better than the record as a whole, which is the one comparison here that favours the agent: it launches work and moves on, so it rarely leaves an interactive allocation running overnight.
Failures that belong to the machine rather than the job
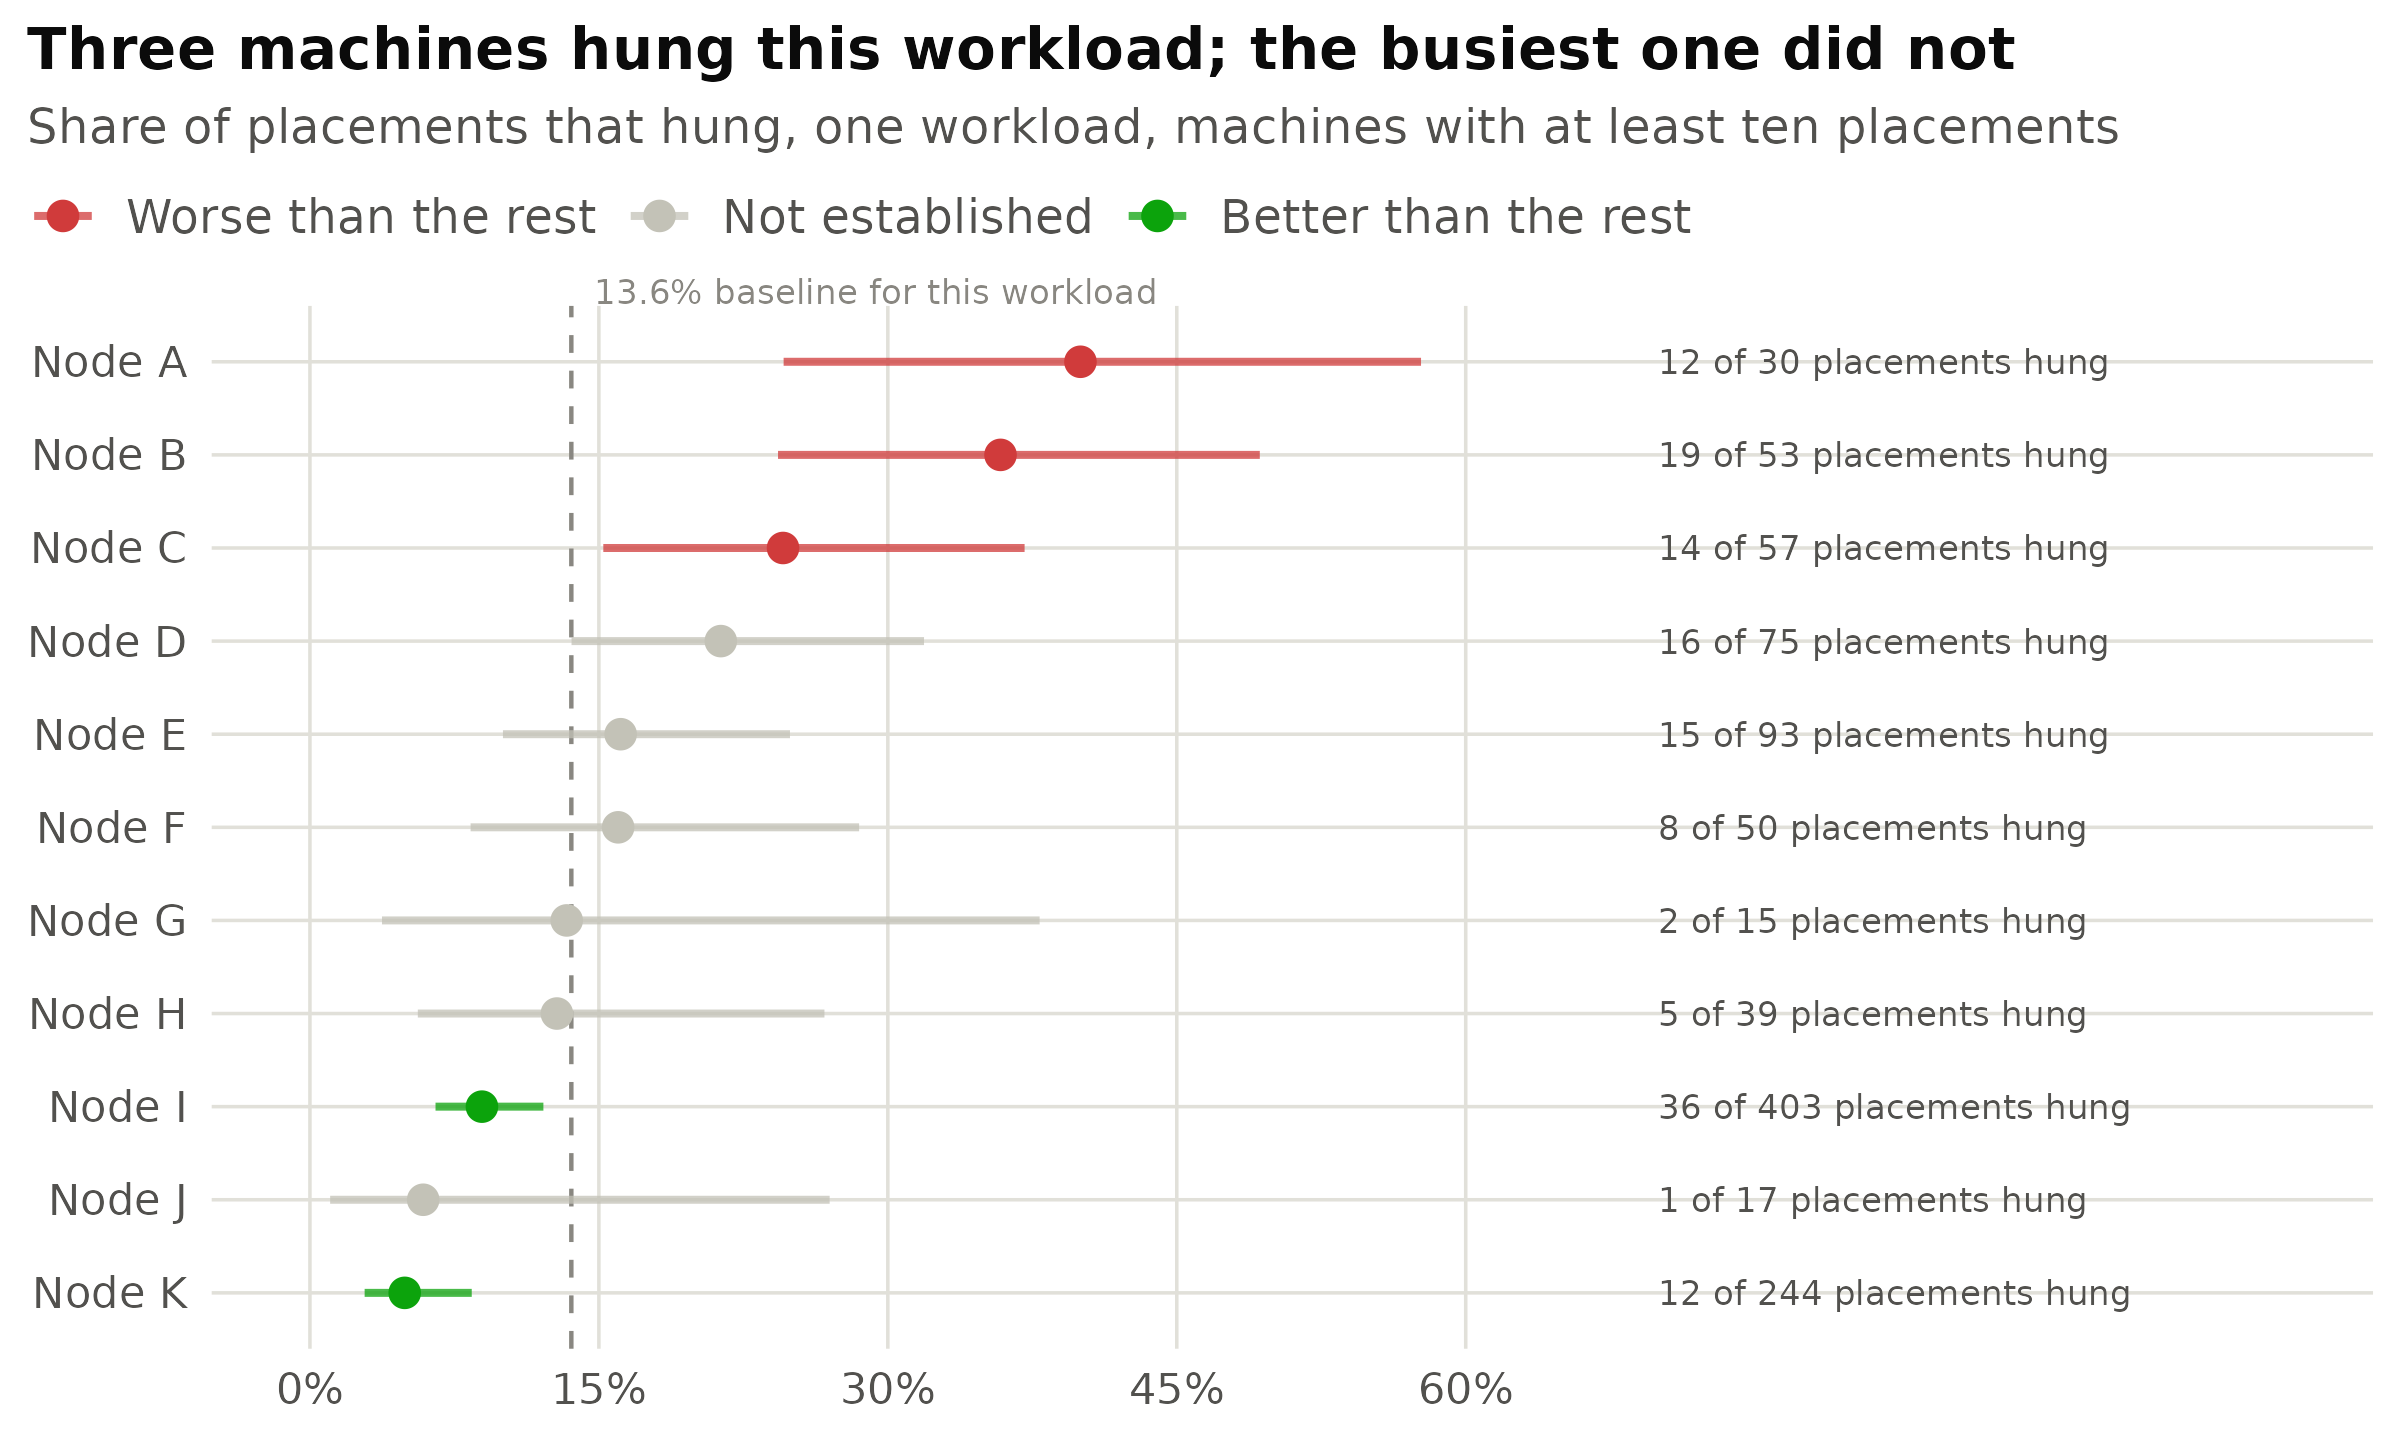
Figure 11: Hang rate by machine within a single workload of 1,098 placements, so that differences in the work itself cannot explain the differences between machines. Bars are 95 per cent Wilson intervals. Each machine is compared against that same workload on every other machine, computed with the machine under test left out. Eight machines had too few placements to test and are omitted, and one further machine’s interval clears the baseline without surviving the correction for testing eleven rows at once.
Node I received 403 of the 1,098 placements, more than any other machine, and is significantly better than the fleet. That is the confound the workload control exists to defeat: a table pooling the baseline across all placements would have compared Node I against a rate that was itself 37 per cent composed of Node I, dragging the comparison toward whatever that machine happened to do and concealing precisely the machines that ran the most work.
For an automated agent the practical value is separate from the statistics. Forty-five runs of this workload hung on the three machines the table names, holding 689 graphics-card hours between them. An agent reading only its own exit codes cannot reach that conclusion; it will reread its own code instead, which is what makes this the most expensive category of failure to diagnose.
The coverage of each instrument
Collecting the failures documented above, the matrix below records what each available signal reveals about each of them. It is deliberately unflattering to the tool this article introduces.
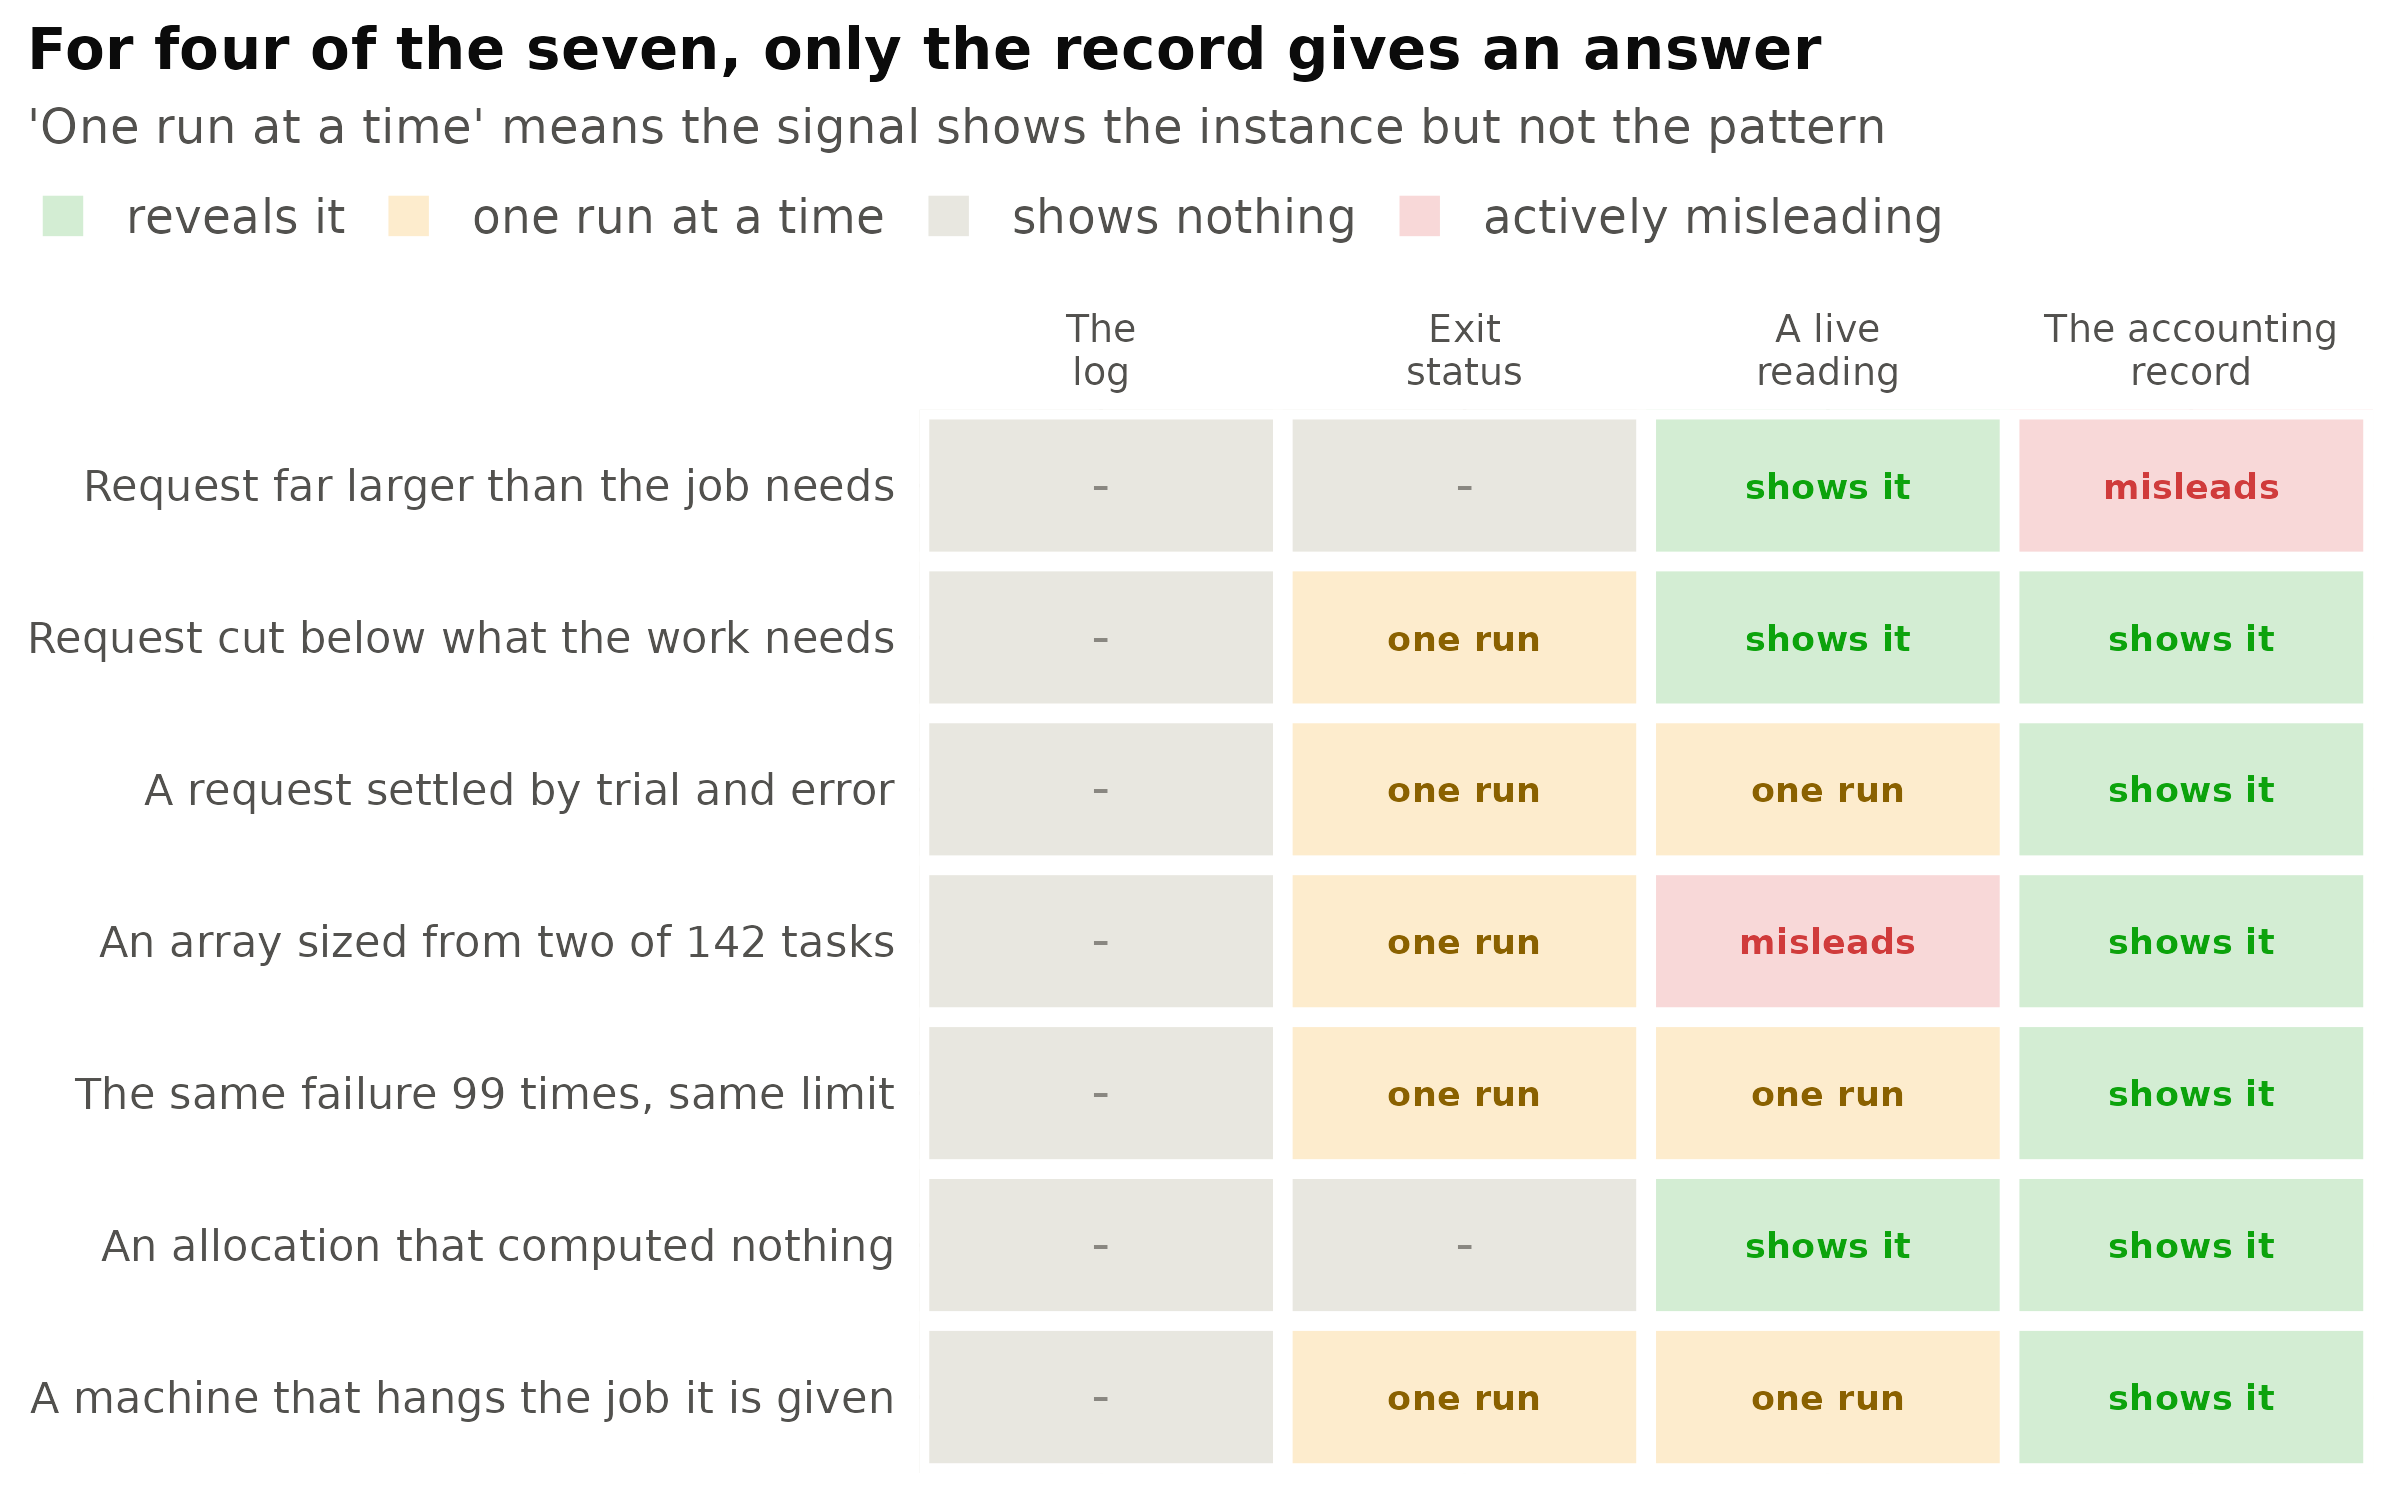
Figure 12: What each signal reveals about each failure documented in this article. ‘A live reading’ is slurmwatch on the run being watched; ‘the accounting record’ is slurmpast over every run of the work. Two cells deserve comment. A live reading is marked misleading on the array because the two tasks that were read peaked at about a seventh of what the corpus required. The accounting record is marked misleading on an over-large memory request because MaxRSS reads high, so sizing against it leaves capacity reserved that nothing will use.
The log, which is the one artefact almost every workflow actually inspects, reveals none of the seven. The exit status reveals five of them one run at a time, which is precisely the mode of failure that produced ten submissions of one tokenizer in an evening: each kill was informative, and none of them carried the previous nine. The single row on which the accounting record is not the answer is the first, which concerns the level of an individual run rather than a pattern across runs. That row belongs to the live reading, and it is the reason both instruments exist.
Interfaces for automated use
Everything above is available without the dashboard. --plain prints the same content as text, and
--json emits all of it, 174 values per job, from analysis modules that import no third-party
package.
from slurmpast import History, Sacct
from slurmpast.sizing import recommend

history = History(Sacct().history(user="you", since="now-30days"))
for advice in recommend(history.groups[0].jobs):
    print(advice.flag, advice.verdict, advice.suggestion)
The cost is what allows this to be a habit rather than an investigation. Over the full history, the
sacct query takes 5.1 seconds and everything after it, including a sizing verdict for every workload,
takes 0.4 seconds. There is no cache and no database, because at that price neither would earn its
complexity.
The instruction is correspondingly small. Before submitting work that has run before, read what it did last time; before resubmitting work that failed, establish whether it has already failed this way. The second is the one that repays the effort, because the strong prior on a failed job is to change the code.
Limitations
The processor recommendation is wrong at the bottom of its range. A job saturating its single core is advised to request two, because the rule multiplies the observed peak by a fixed margin and rounds up, and one core times 1.2 rounds to two. For a single-threaded program that is inverted rather than merely useless, and on this history it is frequent enough to turn a 4.9 per cent saving into a 19.6 per cent increase. The premise is sound; the margin does not belong at a scale where the next value is double.
The memory recommendation inherits MaxRSS, which reads high, so it errs in the direction that
reserves capacity rather than the one that destroys runs. The tool says so at the point of advice and
refers the question to slurmwatch. This is a genuine ceiling on what a post-mortem achieves alone.
A verdict requires three runs, and most workloads in any real history are run once. The refusal is reported rather than filled in, which also means the coverage above is a minority of the workloads, albeit most of the compute.
The thresholds are heuristics from one cluster. What is measured is portable; what is judged is calibrated. Each threshold is a named constant, so recalibration means editing a number.
Attribution to Claude Code is partial, and structurally so. Of the 13,954 records, 5,614 predate the oldest session transcript still on disk, and 1,596 more inside the transcript window came from a driver script or from the command line, so no identifier reached a transcript. The figures describing requests use only the attributable portion; those describing the whole record say so.
The record the agent does not keep
The earlier article concluded that Claude Code is not poor at HPC work but blind to one quantity, and that the remedy is an instrument rather than an instruction. This history extends that conclusion in a direction live readings alone could not show.
The blindness is not only to a measurement. It is to a history. A submission is written, a job runs, and whatever that job revealed about itself is discarded when the session ends. The transcript expires; the next session begins with no knowledge that this work has been run before and measured every time; and the request is composed again by the reasoning that produced it originally. The tokenizer settled by trial and error, the array sized from two unrepresentative shards, the experiment that timed out ninety-nine times at an unchanged limit: none is a failure of reasoning about the job in front of it. Each is a locally correct decision taken without the previous ones in view.
The scheduler retained all of it, in a database that costs five seconds to read. What was absent was neither the data nor the diligence, but a tool that converts the record into the one sentence the next submission requires.
Availability
slurmpast is on PyPI and
GitHub under the MIT licence. It needs Python 3.10
or later and a scheduler with accounting enabled; where accounting is off or sacct is absent it
prints one line of explanation rather than a traceback. Continuous integration covers Python 3.10
through 3.13, both ends of the supported Textual range, and a machine with no Slurm at all, over a
suite of 1,195 tests.
slurmpast --demo runs the whole dashboard against a synthetic history, which is the quickest way to
establish whether it answers a question worth asking.